![]()
By Amir Kamandlooie*, Scott Rouse**, and Lucas Oliveira***
Energy@Work is sharing its experience to help unleash the potential for economic energy efficiency (EE) within the commercial office sector. By following EVO's IPMVP Non-Routine Events and Adjustments application guide (NRE/A Guide), we implemented Non-Routine Adjustment (NRA) Method #2, #6, and #10 to help Toronto Hydro verify 16,717,742 kWh across 21 commercial offices from 2017 to December 31, 2020. The avoided electricity savings is equivalent to the average annual electricity use of 1,922 Ontario homes.
 This case study focuses on one example, a commercial office located at 4711Yonge St. in North York, Toronto, operated and managed by Menkes Developments. This is a high-performing 16-storey Class A commercial office building built in 1987 that achieved Energy Star Building Certification. This building is of particular interest because the verification process also included a correction for a major LED lighting retrofit and EE savings during Pandemic versus lower occupancy. There were numerous awards, including BOMA Toronto's Crest Award for Collaboration and Innovation Excellence.
Menkes is committed to continuous improvement and adopted Energy@Work's Energy Management Action Plan (E-MAP) in May 2017 to assist with their Environmental, Social, and Governance (ESG) commitments: Sustainability. We appreciate the privilege of contributing to their commitment and believe their success were due to:
i) A superior operating team that was committed to improvement with support from management.
ii) Being receptive to ideas, changes, as results are tracked and recorded to enabling new challenges. ii) Their understanding, appreciation and application of the process and tools, such as EVO's Non-Routine Events (NRE) and Adjustments (NRA), NRCan's RETScreen, and Energy@Work's E-MAP.
Working together, savings were achieved during an especially challenging time due to COVID restrictions and with a 90% drop in occupancy in 2020. Teamwork prevailed and, with the support from EVO guidelines and tools such as RETScreen, electricity savings were 3rd party verified!
Energy Management Action Plan (E-MAP)
The E-MAP tracks monthly electricity use and records operational changes. During the E-MAP meeting, Energy Efficiency Measures (EEM) are discussed for management approval and implementation. The consistent communication allowed the E-MAP team to brainstorm, obtain management input, and implement EEM.
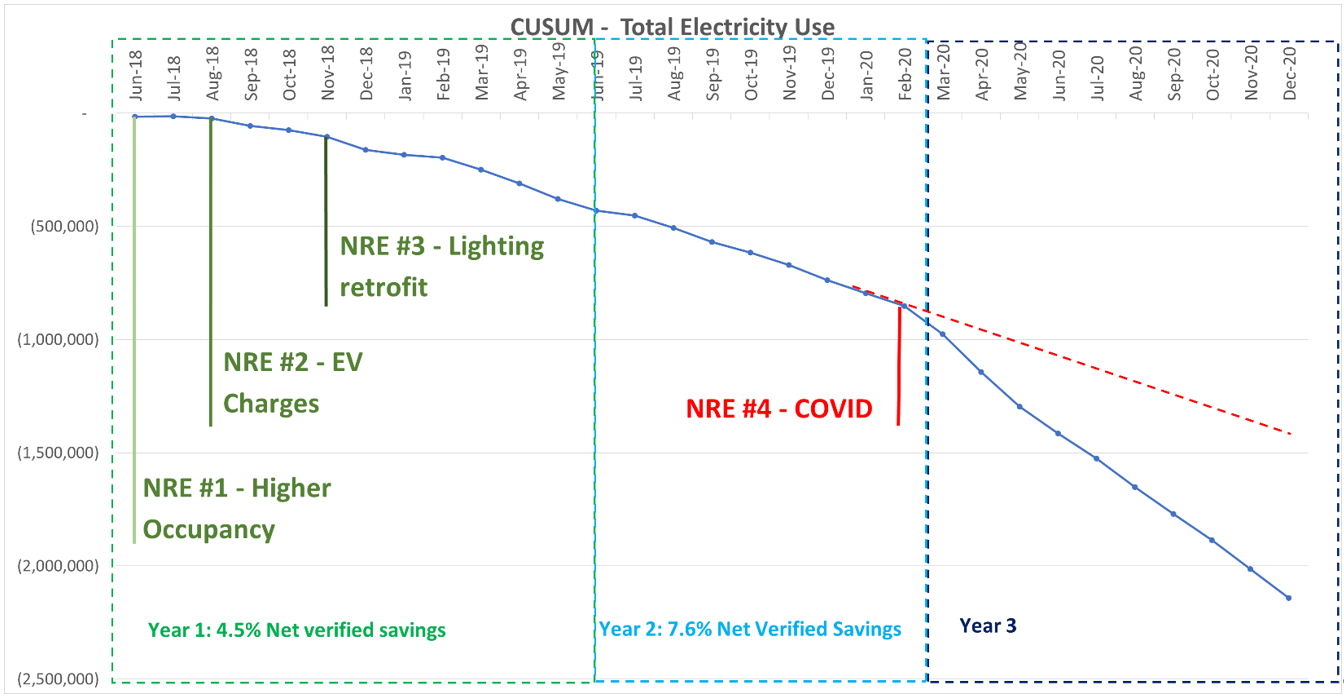
Effective June 1st, 2018, a 3 Year Pay for Performance (P4P) conservation program was introduced. The objective was to reduce electricity use and become eligible for a $0.025/kWh incentive IF Toronto Hydro could verify the savings. A Measurement and Verification (M&V) plan was prepared and approved by Toronto Hydro. Annual reports were provided, as shown in the CUSUM graph.
Figure 1. CUSUM Graph for total electricity for the First, Second, and Third Year of the Pay-for-Performance Incentive Program
Courtesy of RETScreen Software
Year 3 was particularly challenging. The impact of COVID-19 occurred from March 16th, 2020, to December 31st, 2020 with an electricity reduction of 29.5%. To help verify savings, EVO’s Non-Routine Events (NRE) Approaches and Non-Routine Adjustments (NRA) Methods were used per EVO's NRE/A Guide. The slope change in the CUSUM graph, identified as NRE #4: COVID, illustrates the lower occupancy impact due to COVID and the effects of implemented EEM.
The E-MAP team recorded the time for NRE #1, #2, and #3, which EVO's approach confirmed. However, the exact time of NRE #4 was less clear. Therefore, thanks to options presented in EVO's NRE/A Guide, NRE Approach #5 (Tracking Energy Savings with a "CUSUM of savings Chart") was used. An NRA was required to separate and quantify the EE savings from electricity reduction due to less occupancy. The analysis also had to satisfy the P4P requirements to receive the 3rd year incentive.
Our challenge in meeting the P4P requirements to verify electricity savings was how to quantify total electricity EE savings between June 1st, 2018, to December 31st, 2020. The implementation period included these non-routine events:
- NRE #1: increased occupancy in 2018,
- NRE #2: a major LED lighting retrofit in 2019 required the kWh to be removed because an incentive was provided by another program.
- NRE #3: installation of new EV charging stations in 2019, and
- NRE #4: spectacular drop in occupancy in 2020 due to COVID.
EVO Guidelines
The NRE/A Guide published in October 2020 offered solutions to our challenges. EVO’s Guide provided advice on both NREs for identification and NRAs for quantifying the impacts.
There are 7 Approaches to Identify NREs and 10 Methods to Quantify the impact of the NREs, aka, change in static factors. Each may be applicable but will depend on the nature, duration, and impact of NREs as well as the quality of the supporting data.
As is outlined below, for Year 3, NRE Approach #5 was used to detect an NRE, and NRA Method #2, #6 and #10 were used to quantify the impact and IPMVP Option A for the LED retrofit.
a) NRE #1: The monthly headcount was recorded and showed that the occupancy was gradually increasing during the performance period between 2018 and 2019, in comparison to the approved 2017 electricity baseline.
Applying NRA Method #10 ("Engineering Calculation") in a conservative way allowed us to quantify the extra kWh due to higher occupancy during the performance period, pre-COVID.
The increase in plug load from higher occupancy was calculated. The extra HVAC that would also be required was not used, although the cooling load increased to respond to higher ventilation. This decision aligned with the IPMVP principle of being conservative and because metered data was not available. The additional electricity use was calculated by multiplying the extra occupants by the number of working days with a kWh/day/person factor. This was needed for years 1 and 2, but it was not applied due to lower occupancy in year 3.
b) NRE #2: 4711 Yonge added Electric Vehicle (EV) charging stations in August 2018, after the approved baseline.
NRA Method #2 (aka "Use sub-metered Energy Use") quantified the extra kWh use from the EV charging stations that the sub-meter data provided.
Submeter data was available for the EV charging stations that allowed the adjustment.
c) NRE#3: A major LED lighting retrofit received a separate incentive from the P4P program and, therefore, the kWh lighting savings had to be removed from the P4P program savings.
IPMVP Option A isolation was used to quantify the kWh from the LED retrofit and demonstrate Option A's value in a P4P program.
The lighting retrofit project was not considered part of IPMVP Option C. Therefore, a non-routine adjustment using IPMVP Options A, B, or D had to be used. Option A was selected, and the total kWh savings from the LED retrofit was isolated and removed from the P4P savings. The LED annual savings was 266,408 kW and adjusted monthly to meet the M&V reporting requirements.
d) NRE #4: A significant change in occupancy occurred due to the Pandemic, beginning March 16th, 2020.
NRA Method #6 is the use of "mini-models" to quantify the distinction between electricity reductions due to lower occupancy and EE savings through existing EEM.
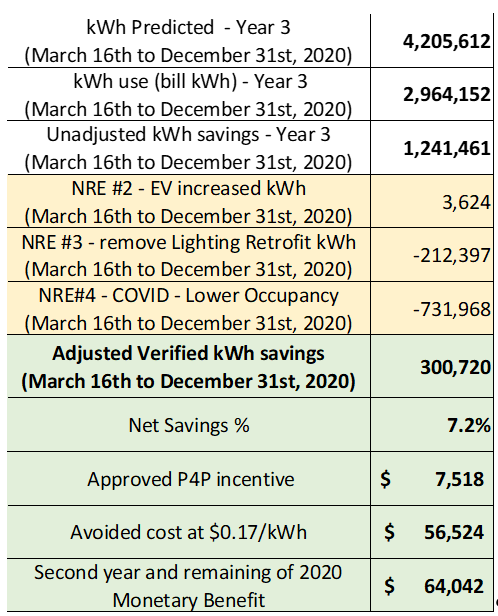
An adjustment of 731,968 kWh was made in the 3rd year to adjust for COVID and the impact from lower occupancy.
The case study demonstrates how NRA Methods #2, #6, and #10 were effective, practical, transparent, and conservative in quantifying electricity impacts. The case study also illustrates the practicality of using IPMVP to isolate and adjust for other projects, such as the LED retrofit project, in this case.
A special mention to NRCan RETScreen Software and the support from the RETScreen team. They were provided the raw electricity data to validate the functionality of the software's new NRA features. These are now available with the release of Revision 8.1 on October 20, 2021. Method #6 was applied and was able to duplicate Energy@Work's calculations and results.
Description of the Measurement and Verification (M&V) Models
4711 Yonge has two main electricity meters. This required two M&V models to satisfy IPMVP for the P4P program. The first meter captured HVAC equipment, and a weather-dependent multi-regression model was required using NRCan RETScreen Software. The second meter primarily captured plug load and lighting; therefore, a weather-independent model was created.
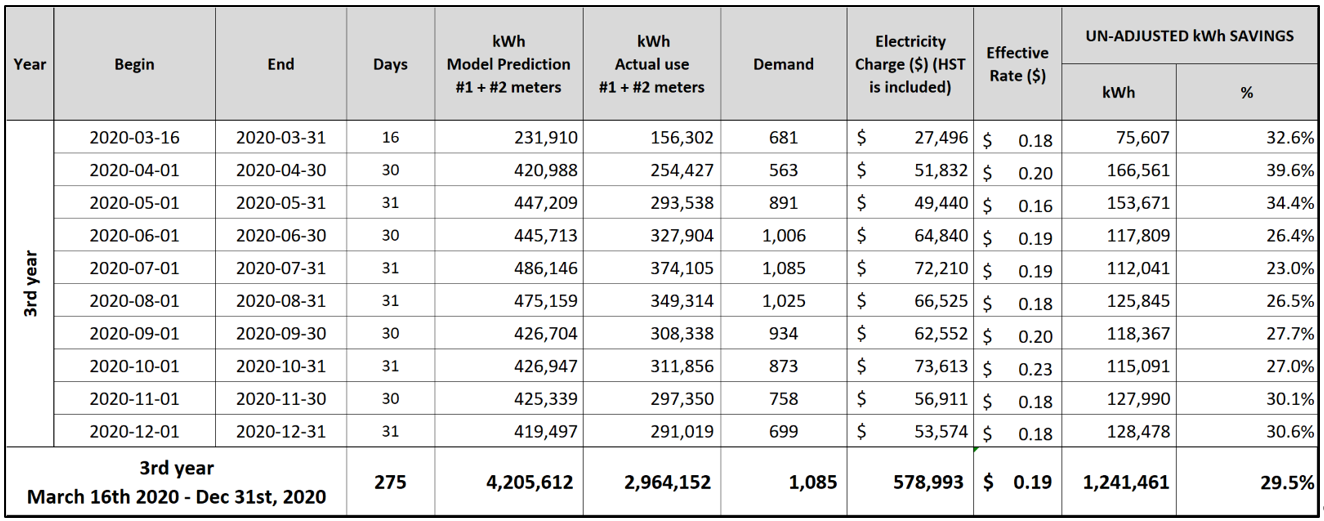
Each model was based on monthly kWh. Toronto Hydro approved the electricity baseline, from February 2017 to February 2018, for both models using their metered electricity hourly data. The monthly unadjusted kWh savings are shown in Table 1
Table 1: Monthly kWh savings for Meter #1 + #2 in year three and after the occurrence of NRE #4
NRE #4 – EVO's NRA Method #6: Use of a "Mini Model"
Due to the unprecedented situation of COVID-19, the second-year annual report was reported from June 1st, 2019, to March 15th, 2020, to avoid the COVID-19 impacts.
The third-year reports began March 16th, 2020, until December 31st, 2020. The monthly E-MAP meetings continued, virtually, throughout the COVID-19 period. Utility use was monitored, and building staff was provided monthly updates on changes in occupancy and operations.
Occupancy was the principal change during the Pandemic since a commercial office must remain open. There were no requests for additional hours of operation or other significant changes, such as removing a data center, disproportionate electricity change, or electricity metering configuration. First and second-year EE measures remained in place during the 3rd year.
According to EVO's NRE/A Guide, NRA Method #6 suggests using mini models to represent the period before the NRE because EEM was implemented throughout the performance period. Meter #2 had a weather-independent model because it was largely plug load. However, because of implementing EEMs and system tuning (i.e., ramp heating improvement), meter #2 became weather-dependent. This is considered a side benefit and is achieved through operational improvements.
Two weather-dependent mini models were created, one for each meter. These were based on the kWh bill data from July 1st, 2019, to March 15th, 2020, and method #6 was successfully implemented.
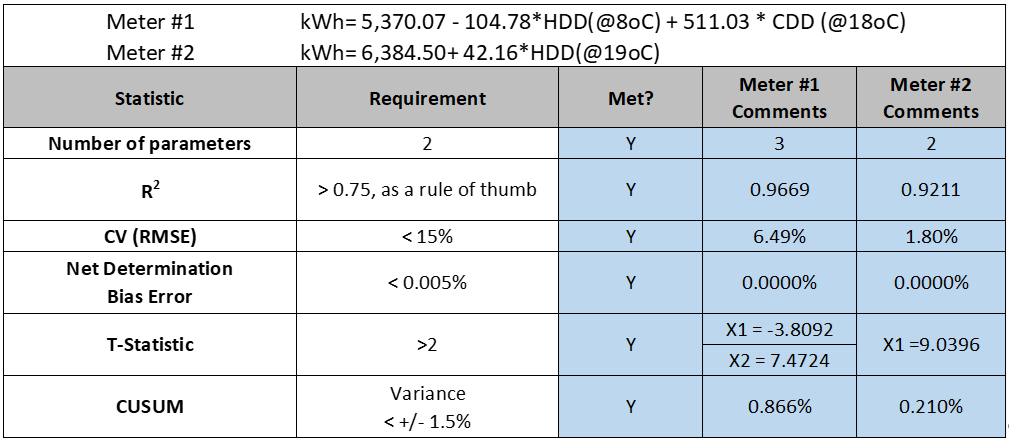
A multi regression model used CDD and HDD for meter #1 and a single regression using HDD for meter #2. This quantified the impact of lower occupancy following NRE #4.
The "mini model" provides an excellent statistical result with an R2 of 0.96 and CV (RMSE) less than 7% for meter #1 and R2 of 0.92 and CV (RMSE) less than 2% for meter #2. Table 2 provides the detailed "mini model" results.
Table 2: Statistical Values of the 'Mini Model' for meter #1 and #2
Although NRA Method #6 does not specify statistical requirements, the same indices are needed to generate the original baseline model for the P4P and are used to evaluate the "mini model."
Applying NRA Method #6's 'Mini Model' Regression Results and CUSUM to Quantify Savings
The CUSUM in Figure 2 shows 387,309 kWh reduction due to lower occupancy during the Pandemic for meter #1, and the CUSUM in Figure 3 shows 344,659 kWh reduction due to lower occupancy during the Pandemic for meter #2
Figure 2. CUSUM Results of meter #1 'Mini' Model (March 16th, 2020, to December 31st, 2020)
Courtesy of RETScreen Software
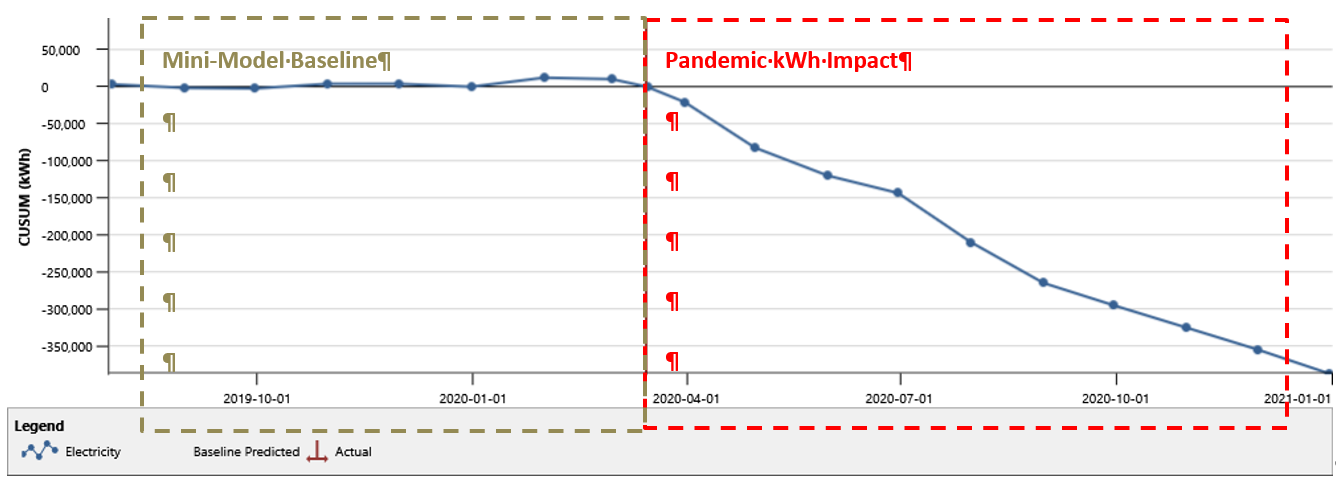
Figure 3. CUSUM Results of meter #2 'Mini' Model (March 16th, 2020, to December 31st, 2020)
Courtesy of RETScreen Software
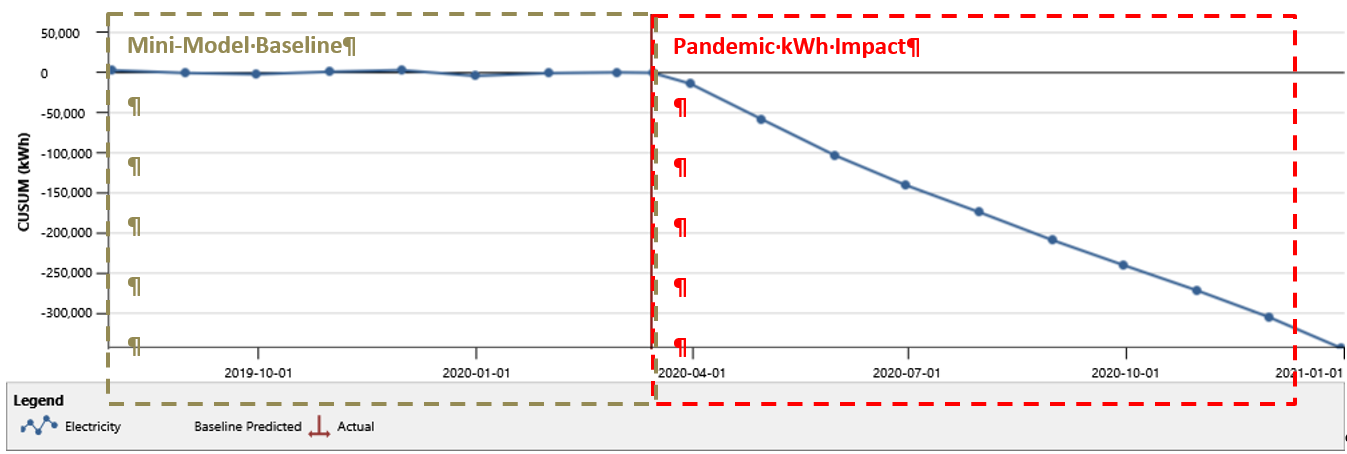
Table 3 summarizes the results from the 3rd year of verified savings, 300,720 kWh
Table 3. Details of Pay-for-Performance Savings Results for the 3rd Year: March to December 2020
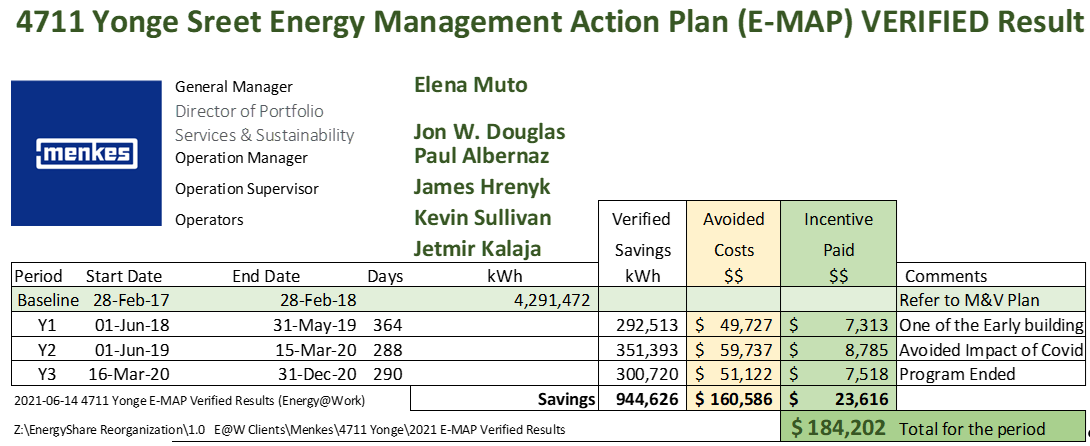
The E-MAP Team and the 3-year P4P program verified savings are outlined below.
Conclusion
Commercial office electricity use offers a significant economic opportunity to improve and contribute to more efficient community targets, as 4711 Yonge Street clearly demonstrated.
EVO's commitment to supporting energy efficiency allowed 4711 Yonge Street to verify electrical savings for the 3-year P4P program by adhering to IPMVP. Although multiple non-routine events occurred, including the Pandemic, and caused significant M&V challenges, the EVO NRE/A Guide provided a comprehensive methodology to overcome these challenges. More importantly, verified results provided the confidence to continue the E-MAP in 2020 and into 2021, after the P4P program ended. The Guide is also considered a cornerstone to new P4P programs looking into establishing baselines and quantifying savings where various NREs, including Pandemic, exist.
The confidence in achieving electricity savings has expanded our attention into achieving water savings and especially natural gas to reduce GHG and help meet carbon reduction targets.
EVO's NRE Approach #5 and NRA Methods #2, #6, and #10 provided the support required to successfully verify the savings in our unprecedented pandemic times. EVO's continued commitment and support are highly appreciated and significantly benefit the M&V community for energy efficiency verification.
Energy@Work submitted a total of 28 P4P reports. Each was impacted by COVID and benefitted from the EVO's Guidelines as well as NRCan's RETScreen. We believe, and hopefully have demonstrated, the economic potential that the commercial office sector offers thanks to the support and commitment exhibited through this case study.
![]()
As always, we welcome questions and feedback which can be directed to:
Amir Kamandlooie, P. Eng., MSc., CMVP, CEM
Technical Director, Energy@Work
amir.kamandlooie@energy-efficiency.com
M: 647.281.1394
Scott Rouse, P. Eng, MBA, CEM, CSDP, CMVP
Managing Partner, Energy@Work
scott.rouse@energy-efficiency.com
M: 416.402.0525
Lucas Oliveira, CMVP
Energy Manager, Energy@Work
lucas.oliveira@energy-efficiency.com
M: 647.382.3712


