
![]() By Dolf van Hattem *
By Dolf van Hattem *
Introduction
For all organizations, energy use has inexorably financial, logistical, and environmental consequences. The financial and logistical aspects belong in the first place to the responsibility of the energy consumer. But the environmental consequences of using energy are clearly a matter of public concern. Therefore, assuring that important energy consumers have an acceptable energy efficiency level is a public interest. This can only be achieved when reliable and meaningful energy reports are available based on a recognized accounting method.
Today, there is no generally accepted standard for energy accounting or reporting. Intending to fill this gap, the Italian Association of Certified Energy Managers (AssoEGE), in collaboration with the Italian Federation for the Rational Use of Energy (FIRE), has developed a methodology for energy accounting which, if applied correctly, will produce reliable, comprehensive, meaningful and transparent performance data of any system which uses energy.
Robust energy reporting is important because it is generally recognized that durable improvements in energy efficiency require permanent energy performance monitoring. A suitable reporting method will improve the usefulness of this monitoring and make meaningful benchmarking exercises possible. The method presented in this document is derived from the standard practices used for financial reporting and allows the presentation of results concisely, similar to financial statements.
In both cases (financial accounting and energy accounting), the challenge for the Reporting Officer (RO) is to represent the performance of an often very complex system in a reduced set of numbers, with the scope to give the reader all the essential data of the system performance. This paper describes the principal elements of this method.
Energy Accounting
An energy accounting system is a set of administrative procedures and formats that produces an energy balance. An energy balance of a system is a numerical representation of all significant energy flows within the reporting boundaries, referring to a delimited period of time in the past.
The energy balance and the energy drivers, define the energy performance of a system. Also, for all organizations, it is an essential data source for quantifying the environmental impact caused by their energy use.
The underlying model
The model used for designing the reporting format is shown in Figure 1. It is assumed that this model can faithfully represent every energy system, and each arrow in the figure may represent one or more energy vectors.
The accounting is done by geographical site. In a multi-site entity, the data are consolidated at the company level. So, the approach is bottom-up. The entity's performance is established by summing the performances of its components.
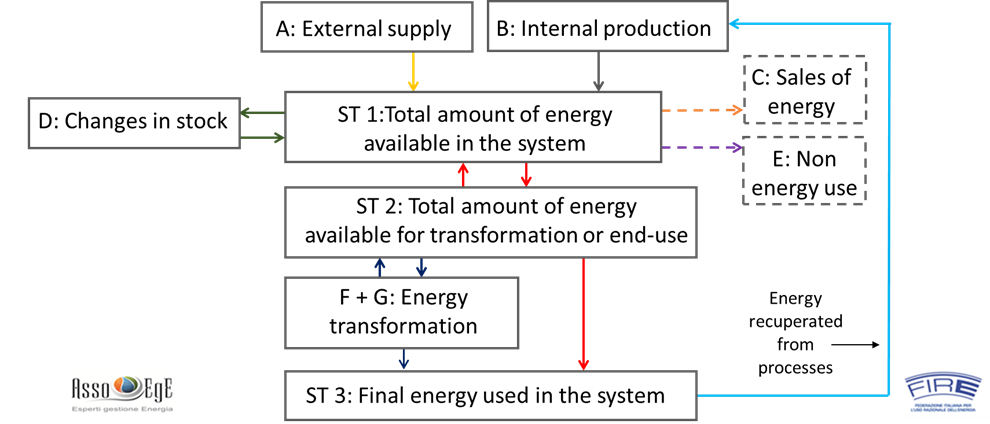
Fig. 1 — Model used for the AssoEGE-FIRE reporting format.
All significant energy flows in the system are measured or estimated and integrated over time.
Using this model, two tables have been designed: the Supply Table and the Use Table. The schematic layout of the two tables is shown in Figure 2.
The Supply and Use Tables
As the names suggest, the Supply and Use Tables are designed to show how much of the final energy is made available for consumption in the system (Supply Table) and how this energy is used by all the centers of energy consumption (Use Table). Both tables are matrixes with energy vectors in the columns and processes in the rows. The number of columns and rows may be increased or reduced as required for good reporting on a specific case. A very high level of detail can be achieved using accounts and sub-accounts. When communicating the results, the accounts may be aggregated according to the audience to be addressed. In this manner, maximum flexibility is achieved.
The Chapters in the Supply Table must always be those shown in Figure 2. Also, the labels of these Chapters should be left unchanged. This ensures that the energy balances of different organizations will look all the same and can therefore be understood and analyzed more efficiently by independent experts (like in the world of financial accounting). For the Use Table, no such obligation exists because this table is very dependent on the kind and size of the reporting organization. Each organization should adapt the format for its specific needs by adding columns and rows.

Figure 2 — Layout of the Supply and Use Tables
The bottom line in the Supply Table gives the total amount of final energy available for end use. Putting these amounts in evidence is an essential feature of the method. It allows, when comparing the performance of two similar energy systems, e.g., two paper mills, to establish whether the differences in energy performance are due to a more efficient production process or to a more efficient transformation process (e.g., co-generators) or both.
The last column in both tables contains the sums of all values on the row after conversion to a common measurement unit for energy. The conversion factors used for calculating the data in the last column of both tables should be listed in a separate table.
The number of columns of the tables depends on how many energy vectors are present in the system, and each energy vector should be reported in a separate column.
Both tables should show only primary information. So, no calculated data, KPI, or other indices are reported in the tables. This type of information is reported in the Explanatory Note, which is part of the reporting format. In Figure 3, an example of the Supply- and Use Table is given for the case of a simple system.
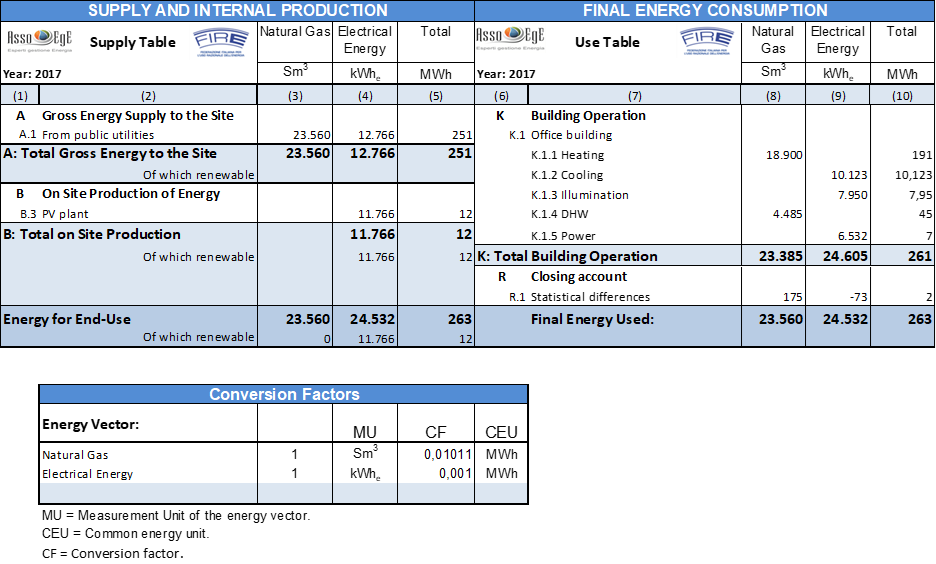
Figure 3 — Example of a Supply- and Use Table for a simple energy consumption system.
The Use Table should give a complete list of how the final energy available in the system has been used. That is, which process has used how much, of which type of energy.
Statistical differences
The last account in the Use Table (the account R.1) is called "Statistical differences." This account reports, vector by vector, the differences between the energy supplied for end-use, as shown at the bottom of the Supply Table, and the total energy consumption listed in the Use Table. The numbers reported in this account are calculated for all energy vectors, subtracting the total consumptions from the Supply Table's last line. So, this account makes that the bottom lines of the Supply- and Use Table are perfectly matched. It is similar to the "Profit/Loss" account in financial accounting.
Energy accounting has unavoidable uncertainties in the data (measured or estimated). So, without this account, a perfect match between the energy supplied and the energy used would be highly unlikely. Therefore, this line should always be present in the Use Table since it gives the reader an impression of the uncertainties in the results. Depending on the system and the type of energy vectors involved, the absolute amounts of energy registered on this line should be in the range of 1 % to 5 % of the total amount of final energy involved. Lower values are very unlikely, and higher values indicate low precisions in the measurements (or estimates) and/or incomplete data in the Supply – and Use Tables.
There is no general objective for the accuracy and precision of the data reported. Still, the Explanatory Note should indicate how reliable the results are in line with the data reported statistical differences. If possible, with an interval and the likelihood of the true value being in that interval.
Lower uncertainties usually imply higher costs. The costs for the monitoring and the reporting should be balanced against the value of the information obtained. Once the system is at cruising speed, as a rule of thumb, for a medium/large energy consumer, the yearly costs of energy accounting should not exceed circa 0,5 % of the annual energy costs. For a small site, it could be unavoidable that this figure would be in the range of 2% to 3 %.
More complex systems
The presented method is particularly useful for reporting on systems with a high degree of complexity. Figures 4 and 5 give examples of the Supply- and Use Table of a more complex system. The data do not refer to any existing system but are shown to demonstrate how the reporting format can be used.
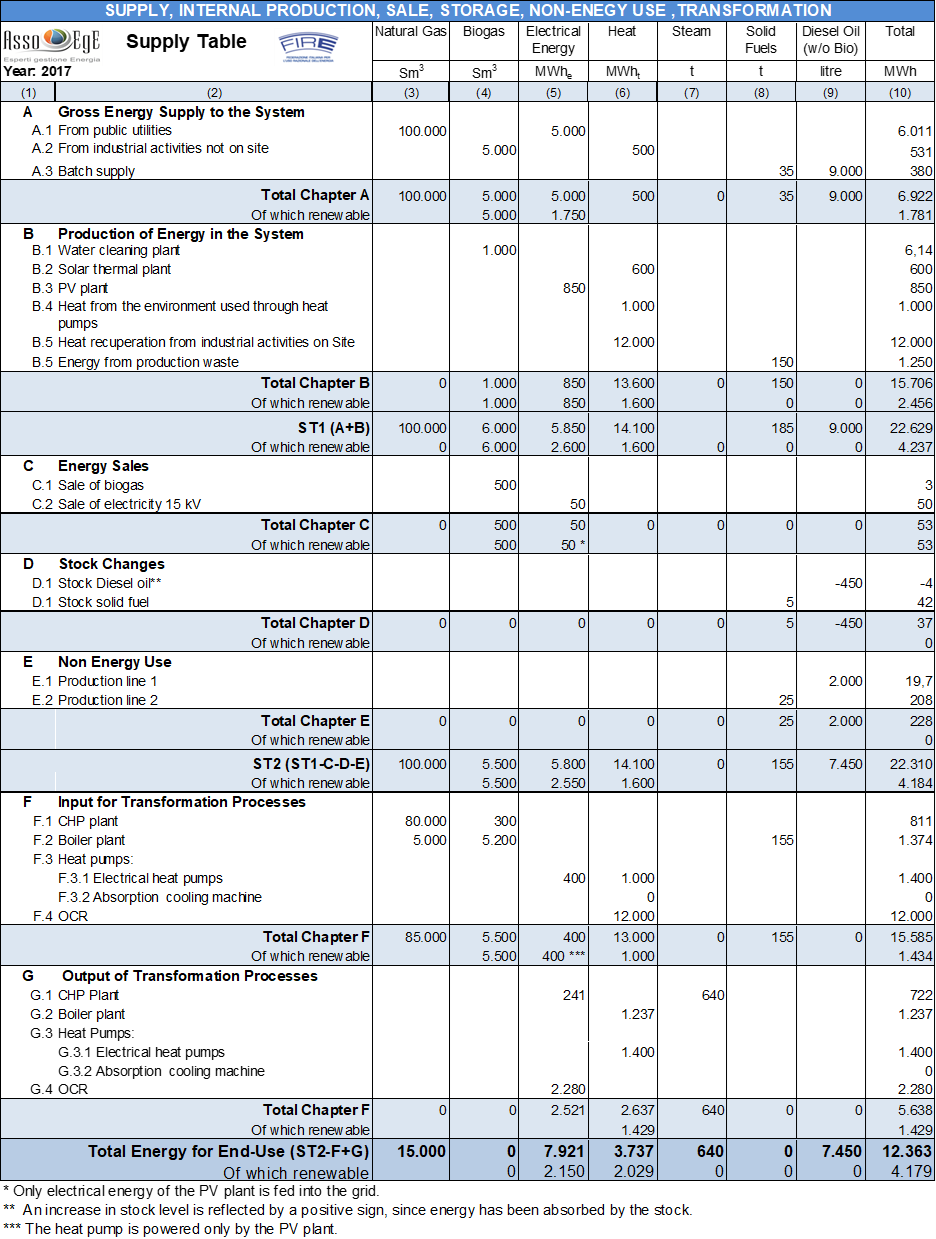
Figure 4— Example of a Supply Table for a complex energy system
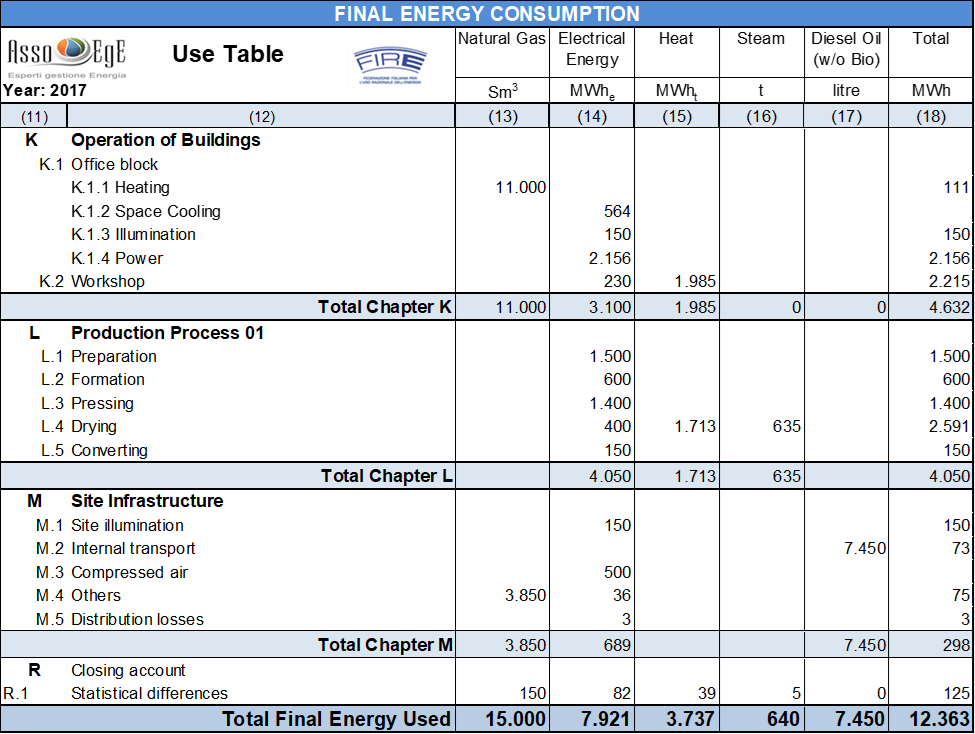
Figure 5— Example of a Use Table for a complex energy system
Figure 4 shows that the reporting format provides ample possibilities to report in a very detailed manner on all kinds of energy vectors such as steam, flows of thermal energy, recuperated energy, and so on. When used in a different process, Recuperated energy should always be booked as a separate energy flow in Chapter B.
Renewable energy
In Figure 4, the subtotal of each chapter is composed of two lines. The first line reports the total values of the chapter, vector by vector, and the second line reports the amounts of renewable energy included in these vectors. At the bottom of the table, the total amounts of renewable energy supplied for end-use purposes are shown for each energy vector.
The Explanatory Note
The Explanatory Note is an essential element of energy reporting. It is similar to a report of an energy audit except that it contains no recommendations concerning possible system improvements. It includes only factual information regarding the reporting entity, the system, the system performance, and the energy accounting process.
The Reporting Officer (RO) should use the Explanatory Note to ensure that the report depicts a true, transparent, and complete view of the system's performance. All information that cannot be given in the Supply- and Use Table should be reported in the Explanatory Note. For example, a system flow diagram should be included in the Explanatory Note. Also, possible conflicts of interest of the RO should be mentioned in the Explanatory Note.
Consolidation of the accounts
The consolidation of the accounts is the process in which the accounts of various sites are summarised in one set of tables with the scope of presenting the overall results of an organization. The local systems to be consolidated may substantially differ from each other.
In principle, all data reported in the Supply- and Use Tables can be added up. However, since the LHV or HHV of certain fuels may change over time and be different for different locations, the best way to consolidate the accounts is to express the local data in energy units, vector by vector, before adding them together.
Environmental impact and carbon accounting
One of the characteristics of the reporting format is that it can provide all the information needed to report on the environmental impact originating from the use of energy in situ (Scope 1 emissions). Following the guidelines of the IPPC, the emissions are inferred from the data on the use of energy (amount, type of energy vector, and process) and the carbon content of each vector. For CO2 emissions, the emission factor (EF) is, in most cases, independent of the process. So each vector has a specific EF. However, CH4 and N2O emissions do depend on the process. So, for these emissions, the EF should be adapted to the process in which the energy is used, e.g., an ICE co-generator, a turbine co-generator, a boiler, etc. The reporting format can handle this requirement without problems since all transformation processes can be reported separately.
So, the EFs for the CO2 emissions can be calculated from the carbon content of the energy vector, assuming that, in the end, all the carbon ends up as carbon dioxide in the air. Different approaches are possible and may be used. For example, one may decide to include the Scope 2 emissions in the EF to take the inefficiencies in electricity production or the leakages in the production and distribution of CH4 into account. In the Explanatory Note, the RO should explain what choices have been made, why, and how the EFs are established. Transparency is essential. Also, the specific value for each EF for all combinations of energy-vector/process in the system should be given.
As seen in Figure 6, the reporting format provides the possibility to report all the raw data needed to calculate the emissions due to energy use in the system. In Column (9) of the Supply Table, the carbon content of the various energy sources used in the system is listed. Similar columns can be added to report the NO2 and CH4 emissions.
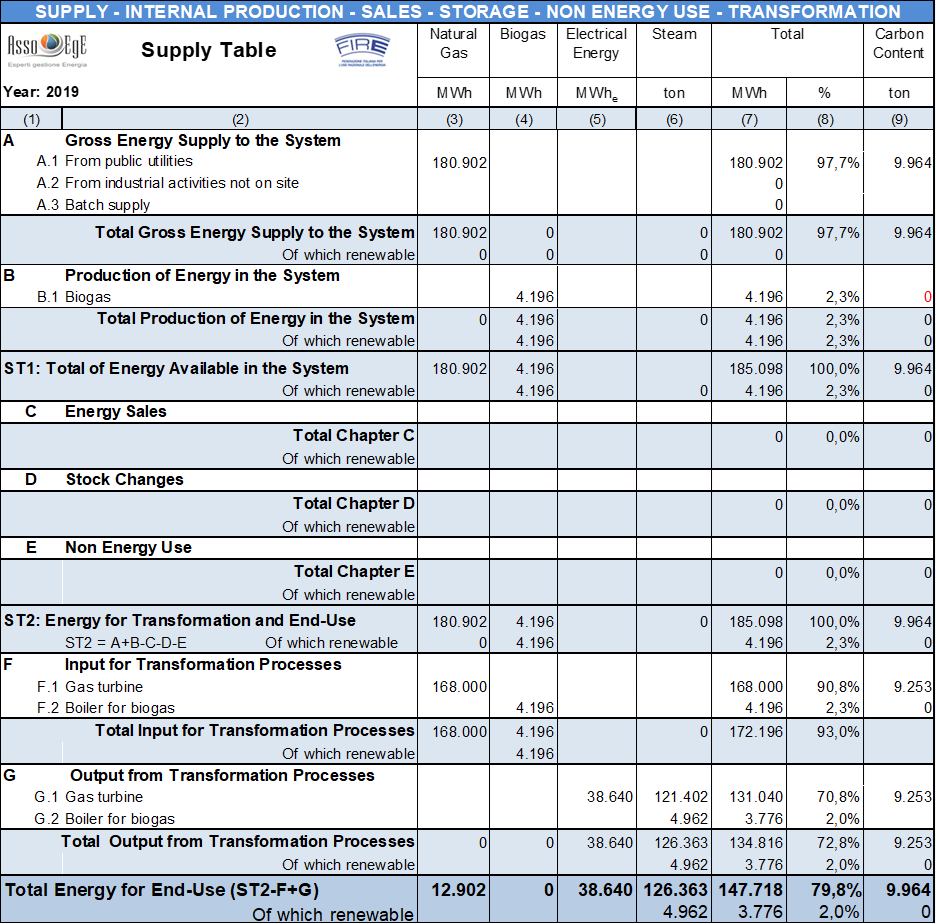
Figure 6 — Supply Table reporting the carbon content in the final energy supplied to the system.
In Figure 7, the Intermediate Table is shown. This table lists the specific emissions for each vector of final energy per unit of energy. With these values, one can attribute the carbon emissions to the Use Table's consumption centers, as shown in Figure 8 (Column (17)). All emissions can be attributed to the various activities and products with this information.
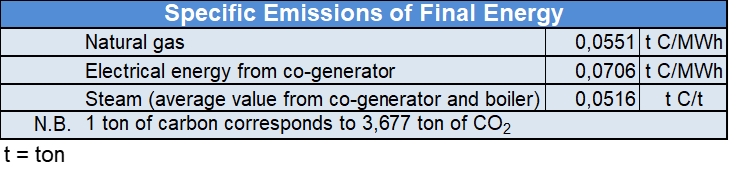
Figure 7 — Intermediate Table, reporting the specific emissions of all vectors of final energy used in the system.
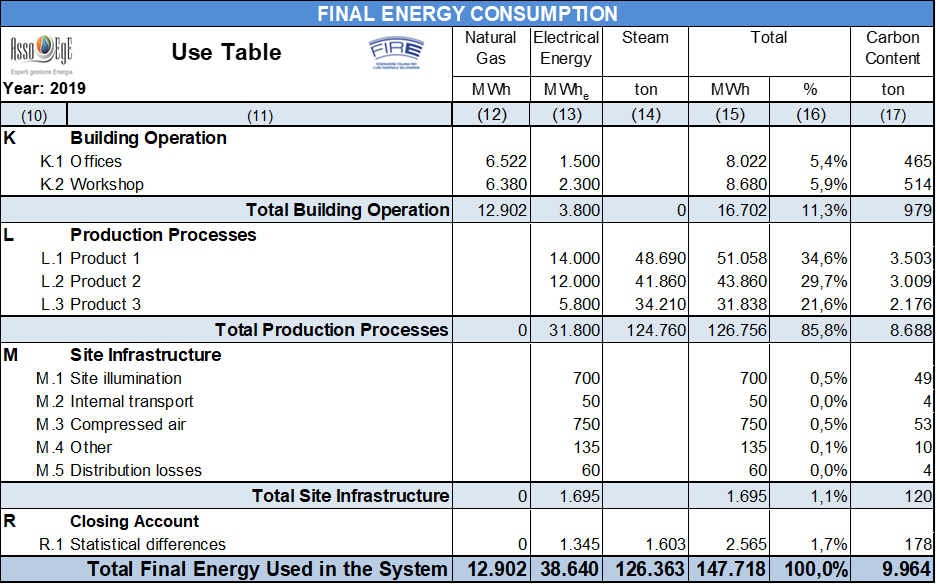
Figure 8 — Use Table, with carbon content used by each energy consumption center in column 17.
Certification of energy balances
Once a widely accepted method for energy accounting is established, it will be possible to use this standard for the certification of energy statements by qualified external experts. This will boost the credibility of the reported data. Doing so would facilitate financing investments in energy efficiency because reliable data on the existing situation is available for project validation.
Conclusions
A complete Energy Report of an entity that intends to comply with this method should always consist of a Supply Table, a Use Table, and an Explicatory Note.
Advantages of the presented reporting format:
- It is adaptable to all kinds of organizations of all sizes and types of activities.
- It provides reliable input for calculating atmospheric emissions, KPIs, and in-depth analysis of the system's energy performance.
- It puts in evidence all the energy sources and transformation processes.
- It provides the data required for comprehensive environmental and energy management.
- It puts in evidence how much final energy is used by the principal processes and activities.
- It makes sense from a physical point of view and allows a straightforward verification that the data are coherent and have acceptable uncertainties.
- It allows for the analytical accounting of the use of final energy.
- It facilitates the consolidation of the accounts of multi-site organizations.
Work is ongoing to extend the format to the reporting on emissions not linked to energy use but which can be attributed to the activities listed in the Use Table. Another item for future developments is the reporting on rejected- but potentially reusable thermal energy, for example, low-grade heat discharged in the environment.
![]()
(*) Dolf van Hattem is Energy expert presso Studio Caramelli S.r.l. Technical Manager presso VH Technology S.r.l.
This article was completed on October 9th, 2022, Sesto Calende (VA), Italy.
Mail: dolf.vanhattem@studiocaramelli.com