By Vilnis Verma *![]()
Clamp-on ultrasonic flow meters are tricky things to deploy and I always get a sinking feeling when somebody says they’re going to use them. In this case they were fitted to measure cooling energy as part of a measurement and verification project. Provisional analysis in the early weeks of the project showed that all was not well: there were big apparent swings in performance, which were unrelated to what we knew was going on on the plant.
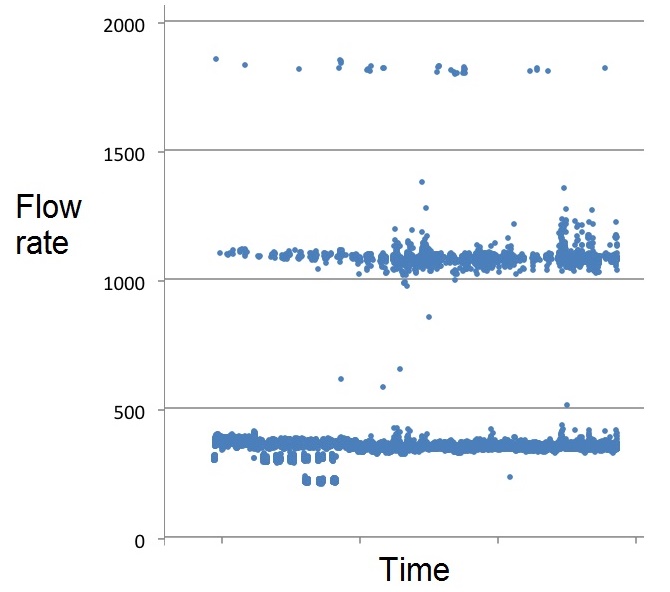
Data from the meters, which were downloaded at one-minute intervals, contained computed kWh values which I was consolidating into hourly totals. The person sending me the data was extracting the kWh figures into a spreadsheet for me but some instinct prompted me to request the raw data, which I noticed contained the flow and temperature readings as well as the kWh results. My colleague Daniel wrote a fast conversion routine which saved our friend the trouble and we discovered that there were occasional huge spikes in the one-minute kWh records which were caused by errors in the volumetric flow rates. The following crude diagram of the minute-by minute flows over several weeks shows that as well as plausible results (under 500 cubic metres per hour) there were families of high readings spaced at multiples of about 750 above that:
Figure 1
The discrepancies were sporadic, rare, and clearly delineated so Dan was able to modify his software to skip the anomalous readings and average over the gaps. We were lucky that flow rates and temperatures were relatively constant, meaning that the loss of an occasional minute per hour was not fatal. He also discovered that the heat meter was zeroing out low readings below a certain threshold, and he plugged those holes by using the flow and differential-temperature data to compute the values which the meter had declined to output.
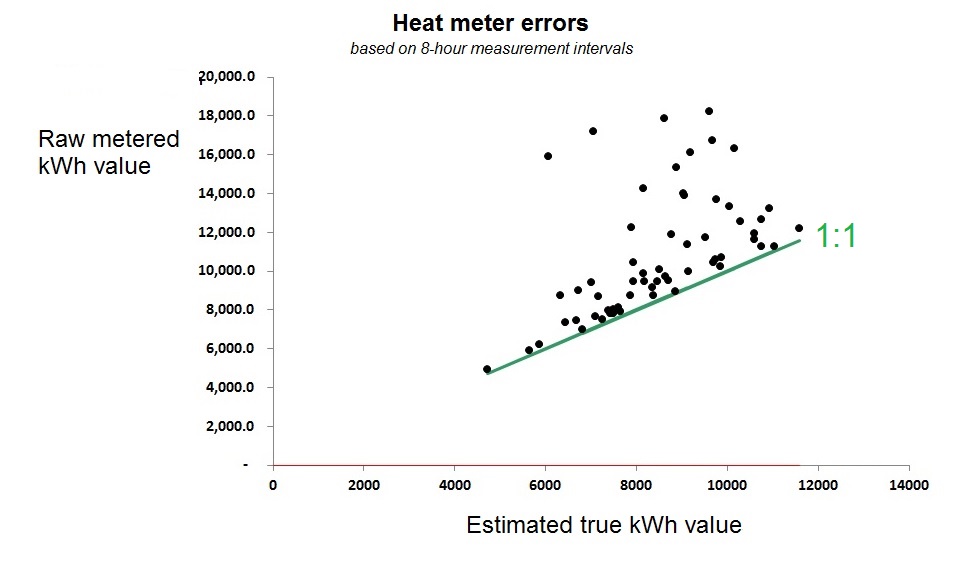
The next diagram shows the relationship between the meter’s kWh output, aggregated to eight-hourly intervals (on the vertical axis) with what we believe to be the true readings (on the horizontal axis). The straight line represents a 1:1 relationship and shows that, quite apart from the gross discrepancies, readings were anomalously high in almost every eight-hour interval.
Figure 2
The effect on our analysis was dramatic. Instead of erratic changes in performance not synchronised with the energy-saving measure being turned on and off, we were able to see clear confirmation that it was having the required effect.
![]()
(*) Vilnis Vesma is a professional engineer and former energy manager who specialises in the analysis of energy consumption data.


