
![]() By Denis Tanguay*
By Denis Tanguay*
When you decide to install an energy efficiency measure in a facility, you must make several hypotheses concerning the equipment performance and prospective scenarios on energy prices and their escalation rates. But these are assumptions, and as such, they do not always materialize. The equipment may not perform as expected. And energy prices may take some unexpected directions. Hence the necessity for inherent risk management.
Homeowners, CFOs, facility managers invariably look at the expected monetary savings and rarely at the energy savings themselves. This is a typical bias. If you invest in an EEM, you are expecting a return on your investment. This return is calculated based on what comes out of your wallet, what comes back, and what appears on a balance sheet.
When things do not turn out as expected, for whatever reason, then measurement and verification (M&V) come into play, particularly crucial information collected before, during, and after the implementation of an energy efficiency measure.
Case Study
In December 2009, a friend of mine had a ground-source heat pump system installed in her house in Southern Ontario, and her installer promised her savings of over $1000 per year. Eighteen months later, I got a panic call from my friend. Her electricity bill was way off what she was expecting.
After investing over $30,000 for the system, her annual savings were minus $51; that is, her total energy spending was higher than before the installation of the GSHP. To figure out what could have happened, I offered to perform an analysis of her energy bills and energy consumption before and after the installation of the GSHP.
Figure 1 below shows the cumulative quarterly energy bills in dollars (natural gas and electricity) before and after installing the GSHP system.
Figure 1
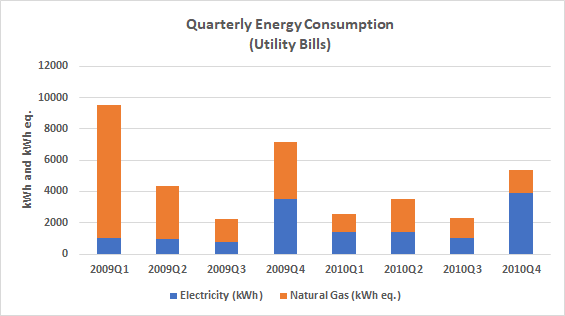
Figure 2 shows the total quarterly energy consumption. We converted natural gas consumption to kWh equivalent (kWh eq.) for comparative purposes.
Figure 2
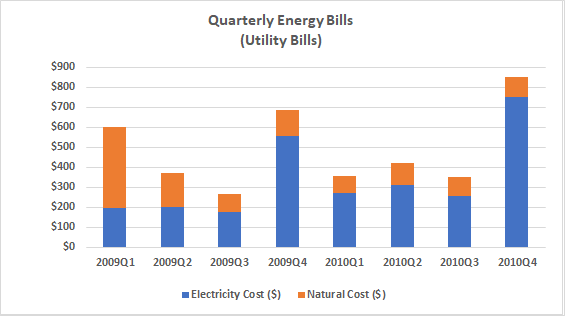
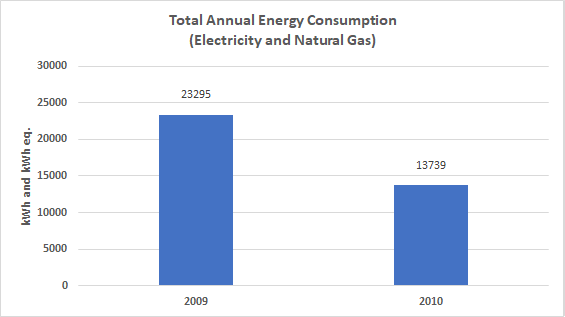
Figure 3 below shows the annual energy consumption in kWh and kWh eq. for electricity and natural gas.
Figure 3
And finally, Figure 4 shows the total annual energy costs for 2009 and 2010.
Figure 4
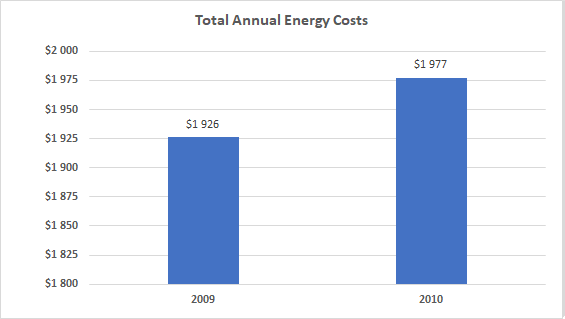
We also adjusted all data for temperature fluctuations using heating degree-days (HDD). The figures above show that the total purchased energy (gas and electricity) is lower after installing the GSHP system. The total annual purchased energy services (adjusted) declined from 23,295 kWh per year before installing the GSHP system to 13,739 kWh. This represents a decline in total energy consumption of 41 %. On the other hand, our analysis showed that the total cost of purchased energy increased by 2.6 %.
How is that possible? I patiently explained to my friend that she was indeed saving a lot of energy. However, that didn't translate into dollar savings due to significant changes in the electricity/natural gas relative energy prices before and after the installation of her GSHP system.
A perfect storm on electricity prices
In 2010, the typical electricity bill for a residential customer in Ontario included many different charges: energy, a new harmonized sales tax regime, a global adjustment charge, a regulatory charge, and a debt retirement charge. Let's take a quick look at each of them and see how they affected my friend's electricity bill.
Energy
In Ontario, the Ontario Energy Board (OEB) sets the basic prices for electricity. As part of their Regulated Price Plan in place at the time, the OEB was reviewing and adjusting electricity prices every six months. For residential, seasonal, and most farm customers, the price of electricity was set to 6.4 cents per kWh up to 1,000 kWh/month and 7.4 cents per kWh for any additional usage on November 1, 2010. The table below shows the price increases at the time of the GSHP installation.
Table 1
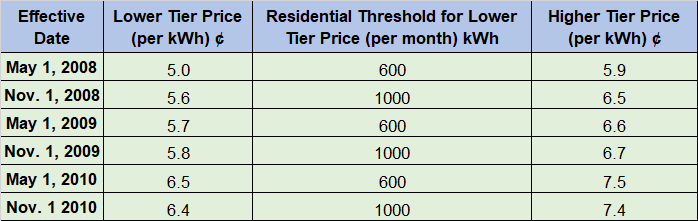
As we can see, there has been a 0.7 ¢ change from May 1, 2009, to November 1, 2010. This may seem like a small change, but it is a 12% increase reflected in energy cost.
GST/HST
As of July 1, 2010, a new harmonized sales tax (HST) was introduced in Ontario and set at 13%. This was a drastic change since the former federal goods and services tax (GST) was 6% with no provincial tax. In other words, the introduction of the HST caused a sharp increase in sales tax of a magnitude of 116%.
Global Adjustment
Electricity generators in Ontario received a combination of payments from the operation of the wholesale market, payments set by regulation, and payments under contracts. The customer portion of the net adjustments arising from these and other authorized payments was included on the customer's bill as the Global Adjustment (GA).
The GA is the difference between the total payments made to certain contracted or regulated generators/demand management projects and market revenues. The total GA was calculated each month by considering the following components:
- GA-OEFC-NUG – Contracts for generators including non-utility generators (NUG) administered by the Ontario Electricity Financial Corporation.
- GA-OPG – Ontario Power Generation's nuclear and baseload hydroelectric generation.
- GA-OPA – Ontario Power Authority contracts with generators and suppliers of conservation services.
The GA was applied to the settlement statement for the last trade day as either a credit or a charge to those participants withdrawing energy from the IESO-controlled grid (excluding exports).
Table 2
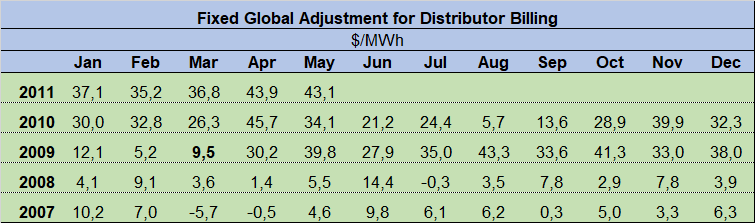
Three estimates from the Global Adjustment were available for local distribution companies (LDC) billing each month. Because these values can be used for distributor billing, the amounts in the table above are positive. A positive value means distributors will charge this rate to their customers. A sharp eye will notice the significant increase starting in May 2009, six months before the installation of my friend's GSHP.
Regulatory Charge
Regulatory charges are the costs of administering the wholesale electricity system. For Standard Supply Service customers (not purchasing the electricity commodity from an electricity retailer), a monthly administration fee of $0.25 was added to the regulatory charge to recover a portion of the cost of systems required for the market.
At the time, regulatory charge equals the number of kWh used multiplied by 0.0068725 or $0.689 per kWh (i.e., xkWh * 0.0068725).
Debt Retirement Charge
Ontario Hydro (a state-owned company) ceased operations on March 31, 1999. It was reorganized in many companies, including Ontario Power Generation, Hydro One, the Independent Electricity System Operator (IESO), and others. The Government of Ontario kept a stranded debt of $39.2 billion. This debt was entrusted to the Ontario Hydro Financial Corporation to manage. They planned to retire it in different ways, including adding the debt retirement charge to all electric utility bills for several years. When my friend installed her GHSP system, the debt retirement charge was 0.7¢ per kWh.
And natural gas prices went down dramatically.
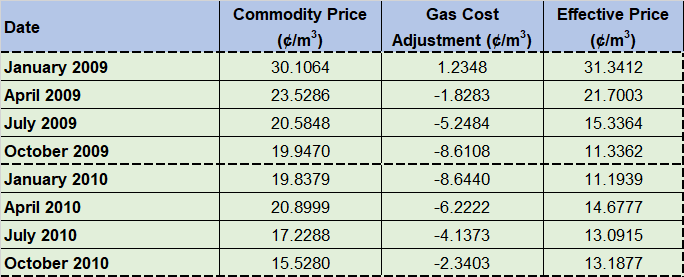
While electricity prices were increasing due to the factors detailed above, natural gas prices declined from an effective price of 31.3412 ¢/m3 in January 2009 to 13.4895 ¢/m3 in January 2011, a 57 % decline. Most of the gas used for heating in 2009 was billed at the higher prices set in January 2009 and April 2009, as shown in Table 3. Natural gas prices remained very low during the following decade.
Table 3
Conclusion
We all know that there is no strict linear relationship between energy savings and monetary savings. A 20 % reduction in electricity use does not automatically translate into a 20 % reduction of the bill received from your distribution company. This, even when the energy-efficient equipment performs as designed and installed.
In this case study, the GSHP system provides the expected energy savings by a magnitude of 41 %. Unexpected price movements combined into a perfect storm for my friend.
- The installation of her GSHP caused a significant (and standard) increase in electricity use when electricity rates were affected with many additional new charges.
- The removal of her natural gas boiler reduced her purchases of natural gas at the time when natural gas prices started declining sharply.
She thus ended up buying more expensive electricity and less cheap natural gas.
The example above shows the importance of gathering the appropriate information before installing an energy efficiency measure, during its installation, and during the performance period. Although this was not a great conclusion for my friend, I would not have rationalized this case without baseline energy use information. Both quantities of energy and expenses gathered from the utility bills were essential.
![]()
(*) Denis Tanguay is the Executive Director of EVO.