
![]() By Marco Rossi * and Marco Memoli **
By Marco Rossi * and Marco Memoli **
We use energy in basically every aspect of our modern life. It is a critical component of energy-intensive sites such as foundries, paper mills, or hospitals, for example. But energy also guarantees our quality of life in less energy-consuming buildings such as flats, offices, commercial buildings, stores, warehouses, etc. The present case study reports on the implementation of relatively standard energy conservation measures (ECMs) implemented at the Viessmann Italia headquarters located in via Brennero, 56 Pescantina (VR) Italy. The site includes an office building and a warehouse. In this case study, we elected to present basic M&V concepts in simple terms, so this case study can be shared and easily understood by business owners and policy makers.
An easy question needs an easy answer
In general, if you have a solid knowledge of a subject matter, you will always be able to provide easy answers to any questions. Dealing with complex issues and providing simple and clear explanations to decision-makers is the key to developing and nurturing an energy efficiency culture. In spreading a culture for efficiency, it is essential to communicate effectively by focusing on the benefits and savings of technologies/practices. Mostly, people want to know how much money they will save thanks to energy conservation measures (ECMs)?
Back in January 2020, and about the ECMs implemented at the Viessmann headquarters, the CEO of Viessmann asked us a straightforward question: How much energy/money did we save in 2019? This was a very simple question, indeed. To provide an appropriate answer, we analyzed the results with relatively simple and typical applications. These tools are fundamental for giving simple answers to whoever is interested in implementing energy efficiency measures.
The Project
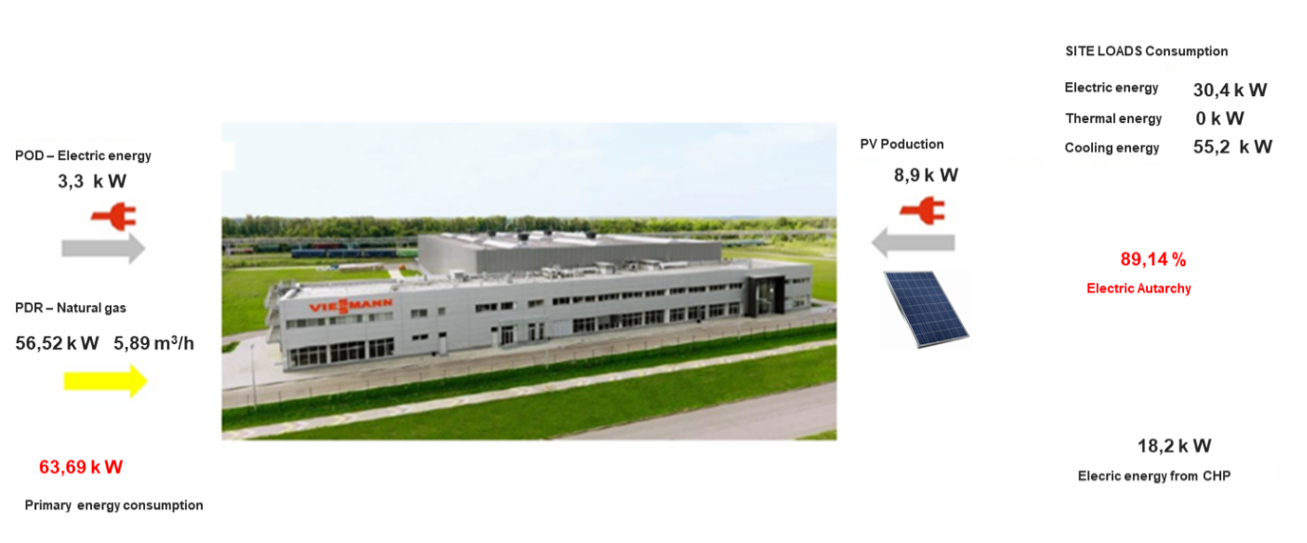
Figure 1 - Monitoring & controlling dashboard - main page
The project consists of a mix of conventional ECMs combined with on-site renewable energy production. The following ECMs have been implemented at the site between 2016 and 2018:
- LED lighting revamping (2016)
- Installation of a photovoltaic system (2017)
- Thermal power station revamping (2018)
- Installation of a new condensing boiler natural gas-fueled (2018)
- Installation of a new Combined Cooling, Heat and Power (CCHP) (2018)
- Installation of variable speed pumps (2018)
- Improved insulation and distribution of fluids (2018)
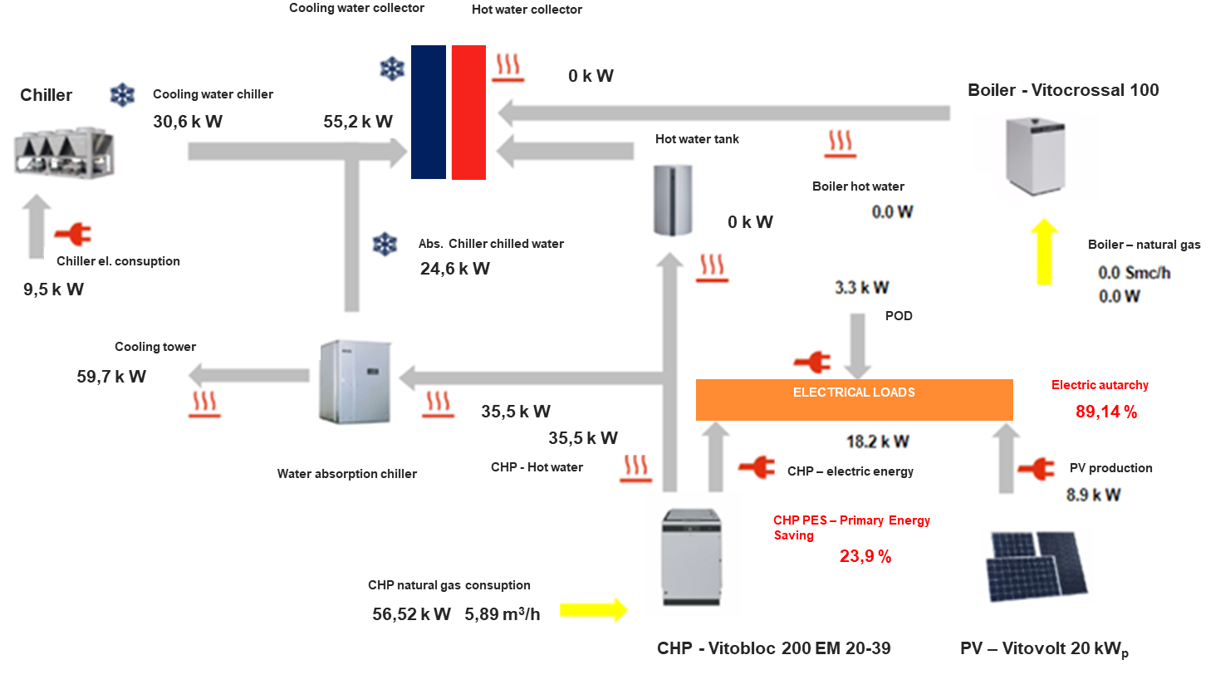
Figure 2 - Monitoring & controlling dashboard – energy flows
The International Performance Measurement and Verification Protocol (IPMVP edition 2016) was the reference for measurement and verification (M&V) of the savings.
How to assess the performance of our ECMs?
According to the basic concepts of IPMVP, «Option C – Whole Facility,» we determine the savings by measuring energy consumption and demand at the whole facility utility meter level. Continuous measurements of the entire facility's energy consumption and demand are taken throughout the reporting period. By analyzing the whole facility baseline and reporting period (i.e., utility) meter data, it is then possible to evaluate savings for the installed ECMs.
What is measurement and verification?
As we all know, M&V is the process of planning, measuring, collecting, and analyzing data to verify and report energy savings within an individual facility resulting from the implementation of ECM.
Why do we need a baseline?
The baseline is essential to define the period chosen to represent the operation of the facility or system before the implementation of an Energy Conservation Measure (ECMs). In the present case study, the baseline period is the calendar year 2015 (ante-ECMs situation).
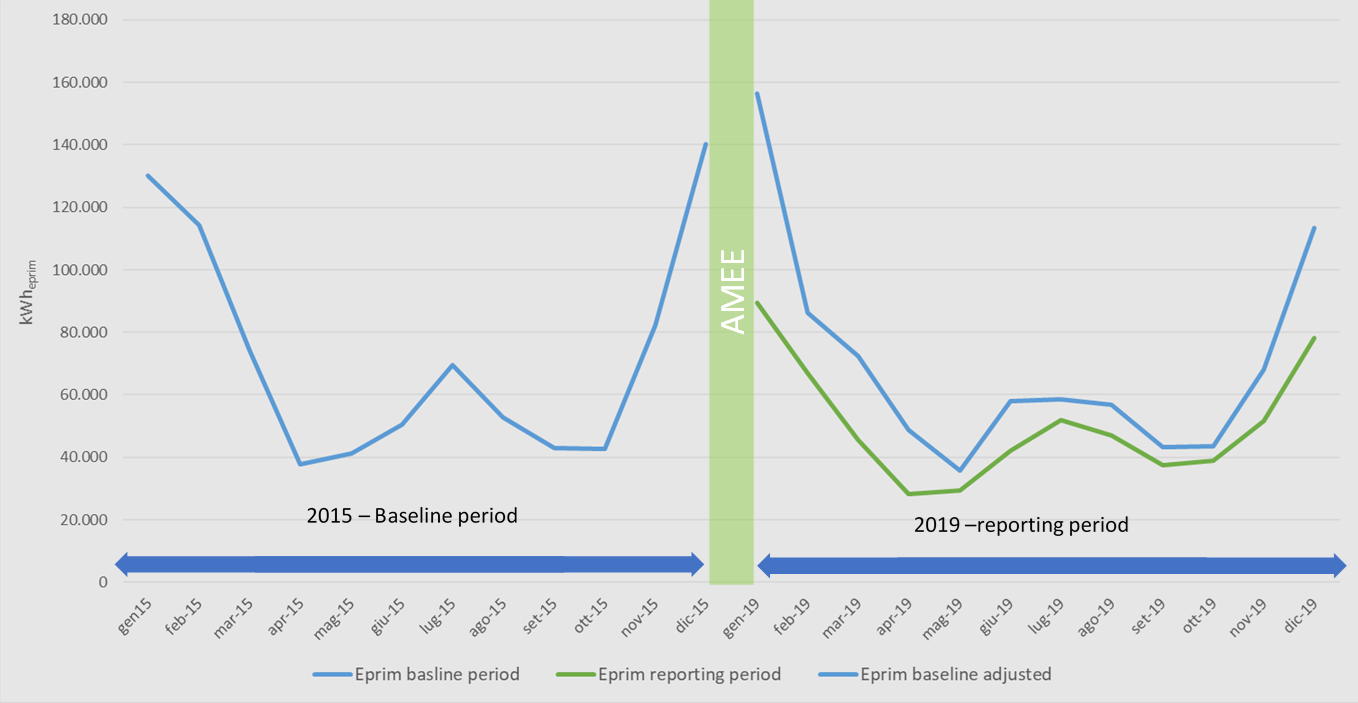
Figure 3 - Savings (primary energy) – Forecast method
Why do we need a reporting period?
The reporting period is chosen to verify savings after the implementation of an Energy Conservation Measure (ECM). For our project, the reporting period is the calendar year 2019 (post-ECMs).
Figure 4 - Electricity - 2019 profiles
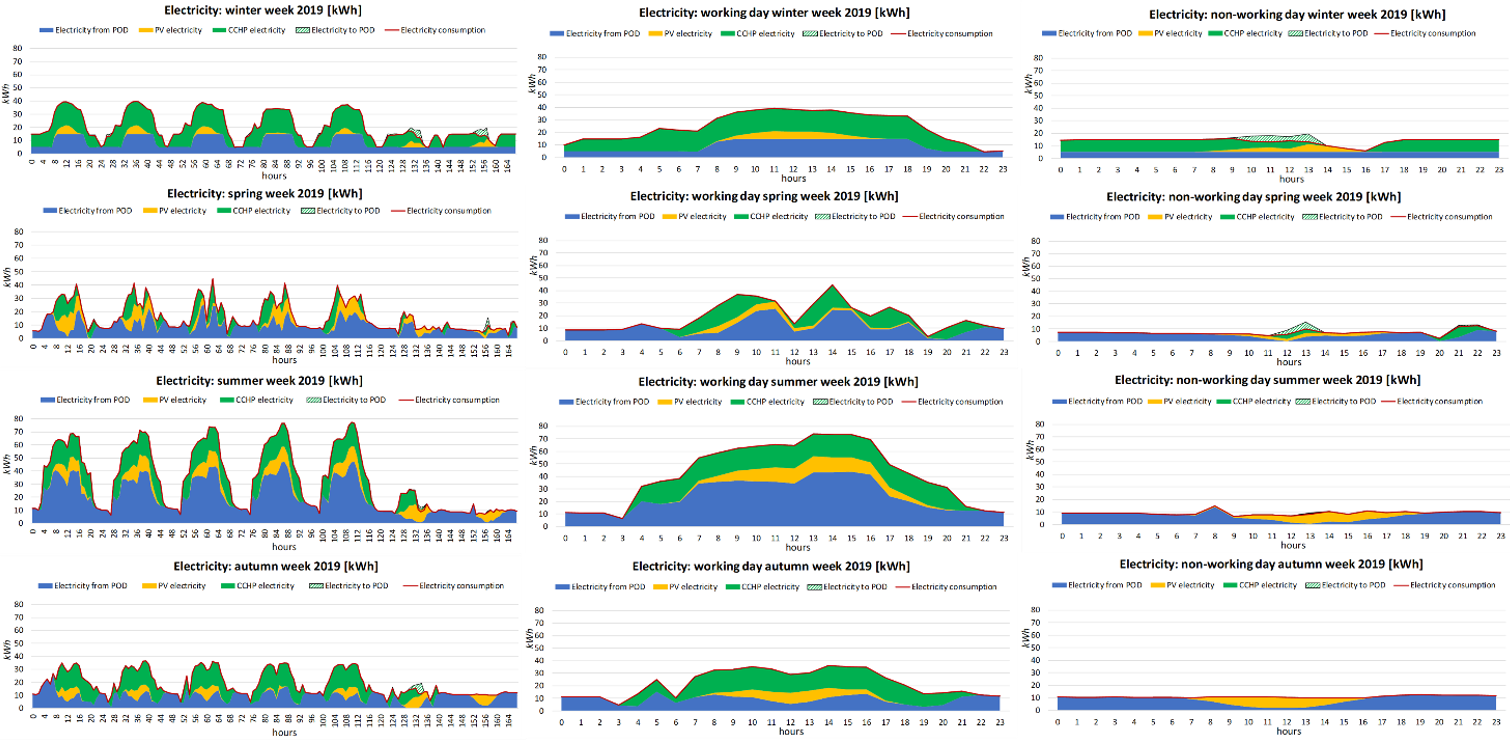
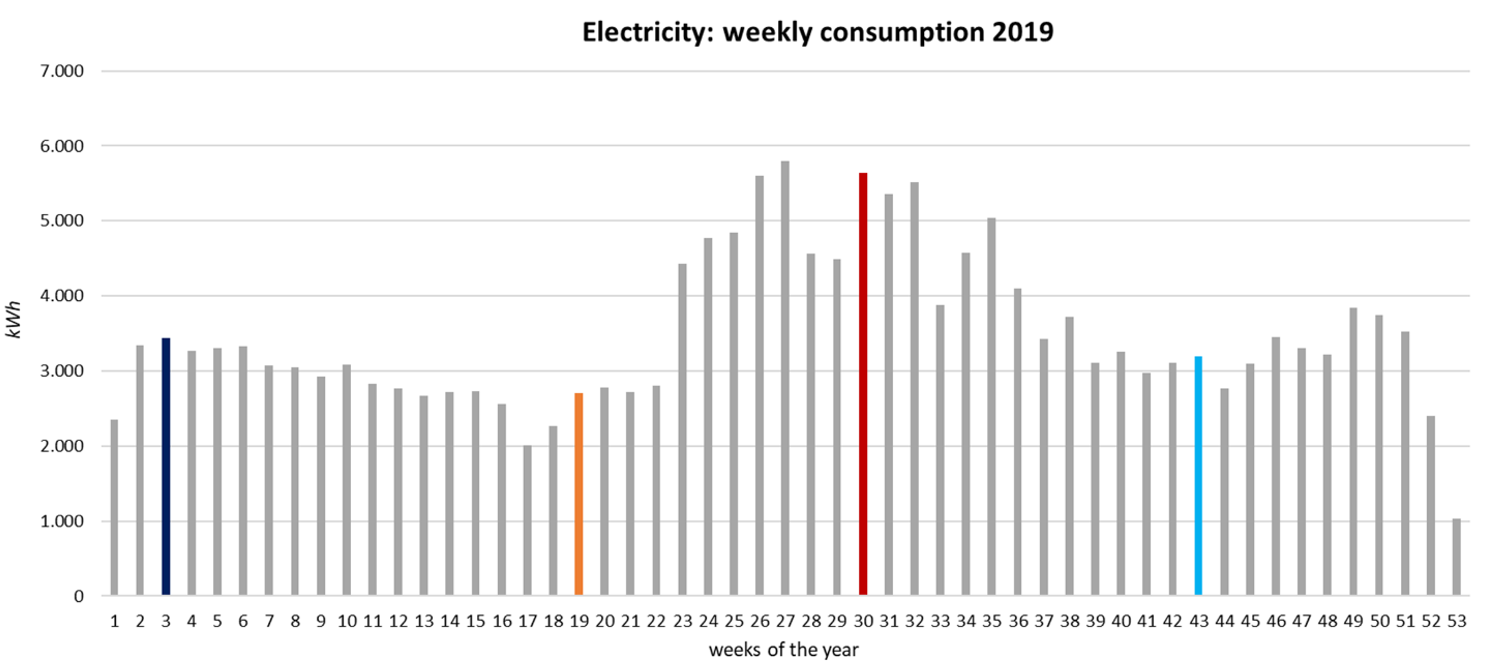
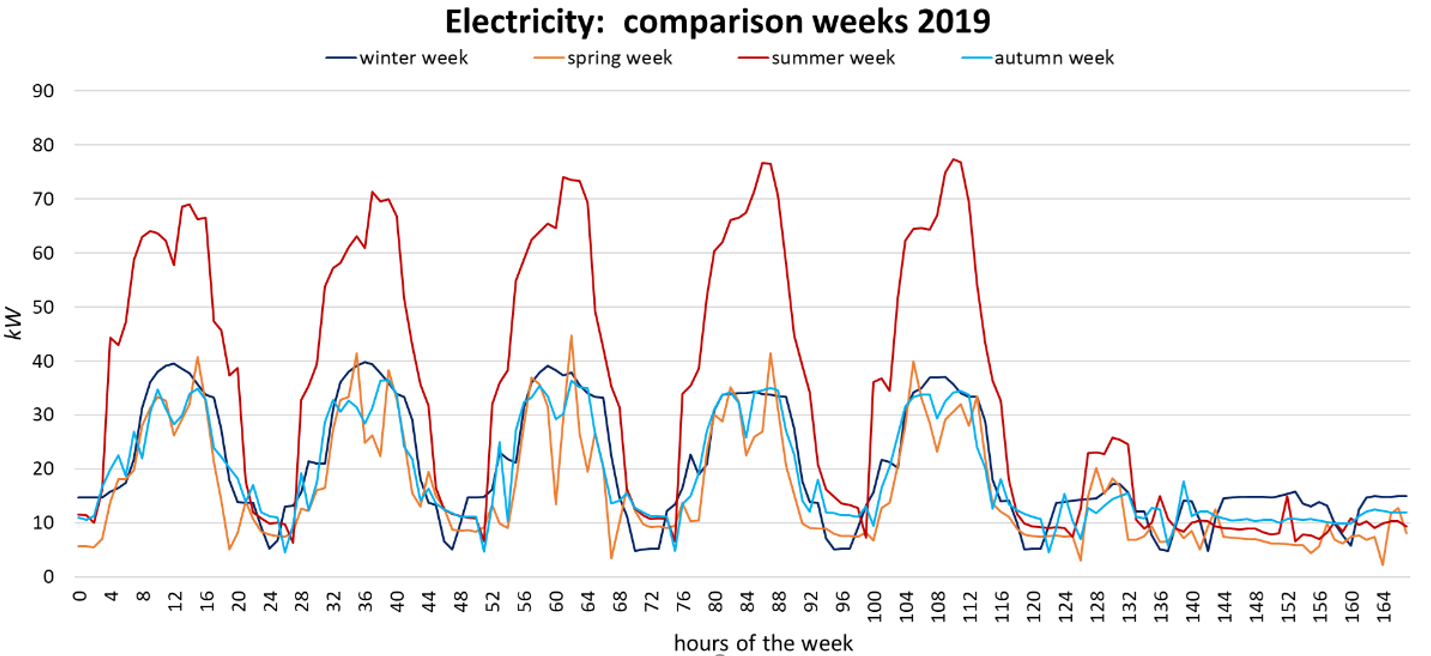
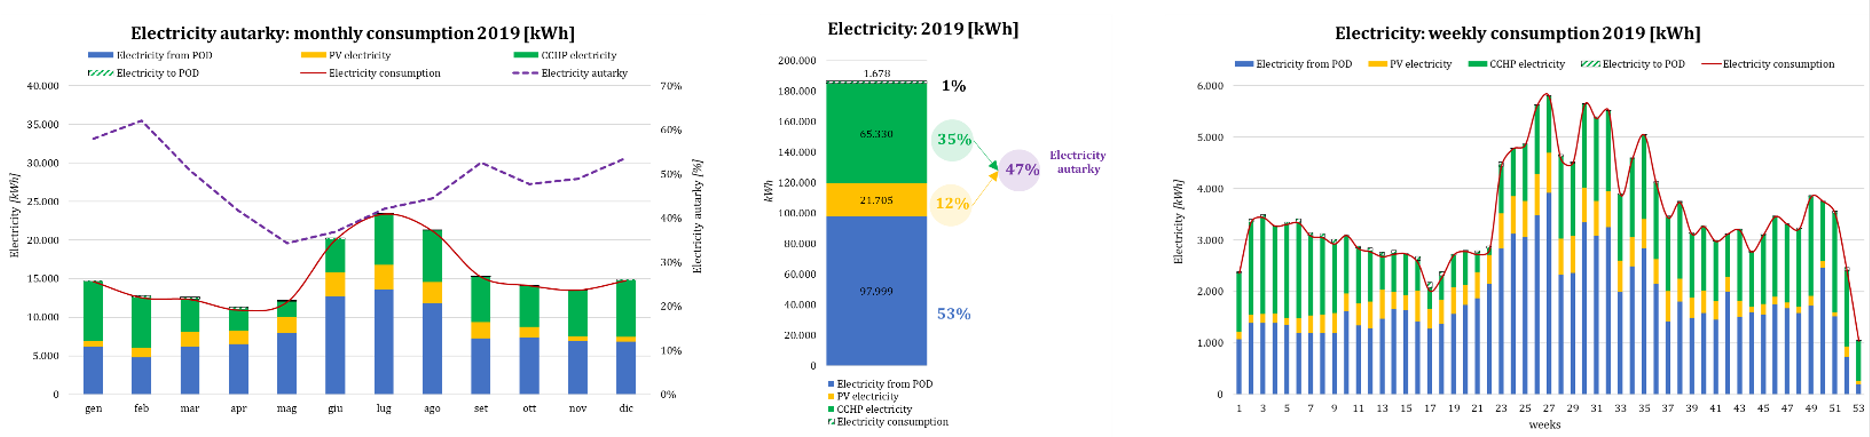
Figure 5 - Natural Gas 2019 – data
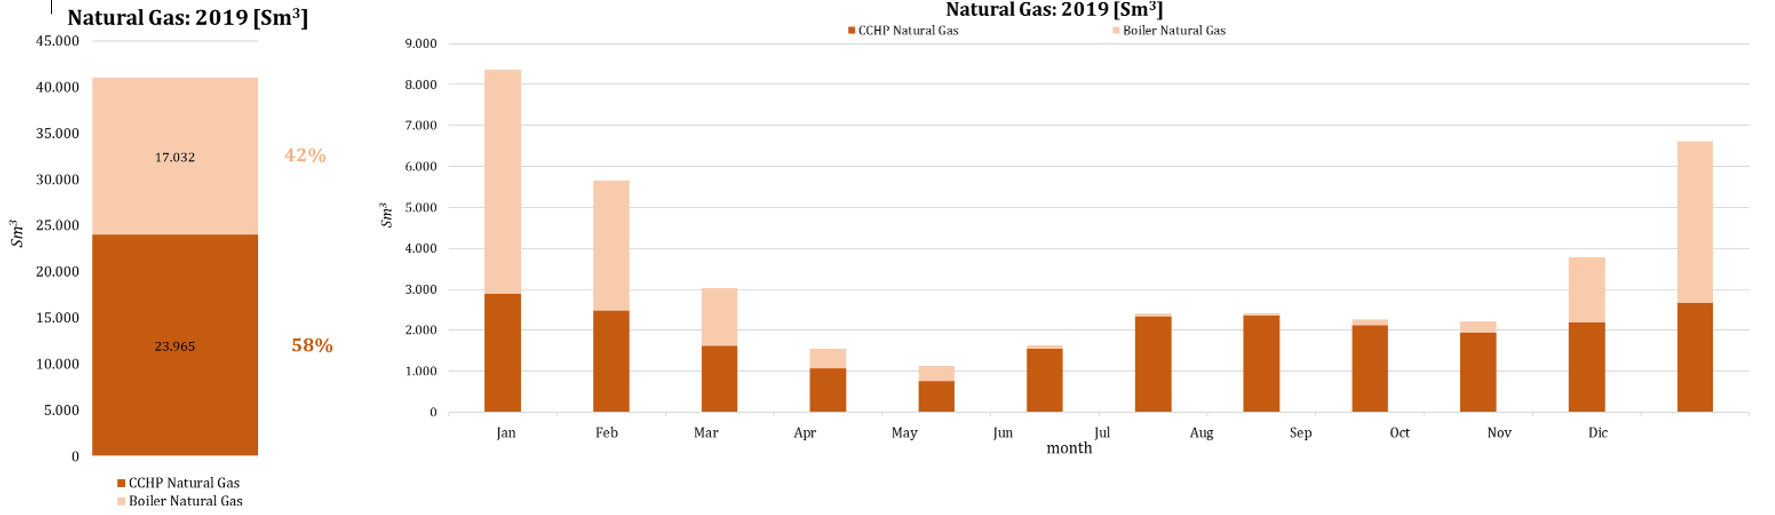
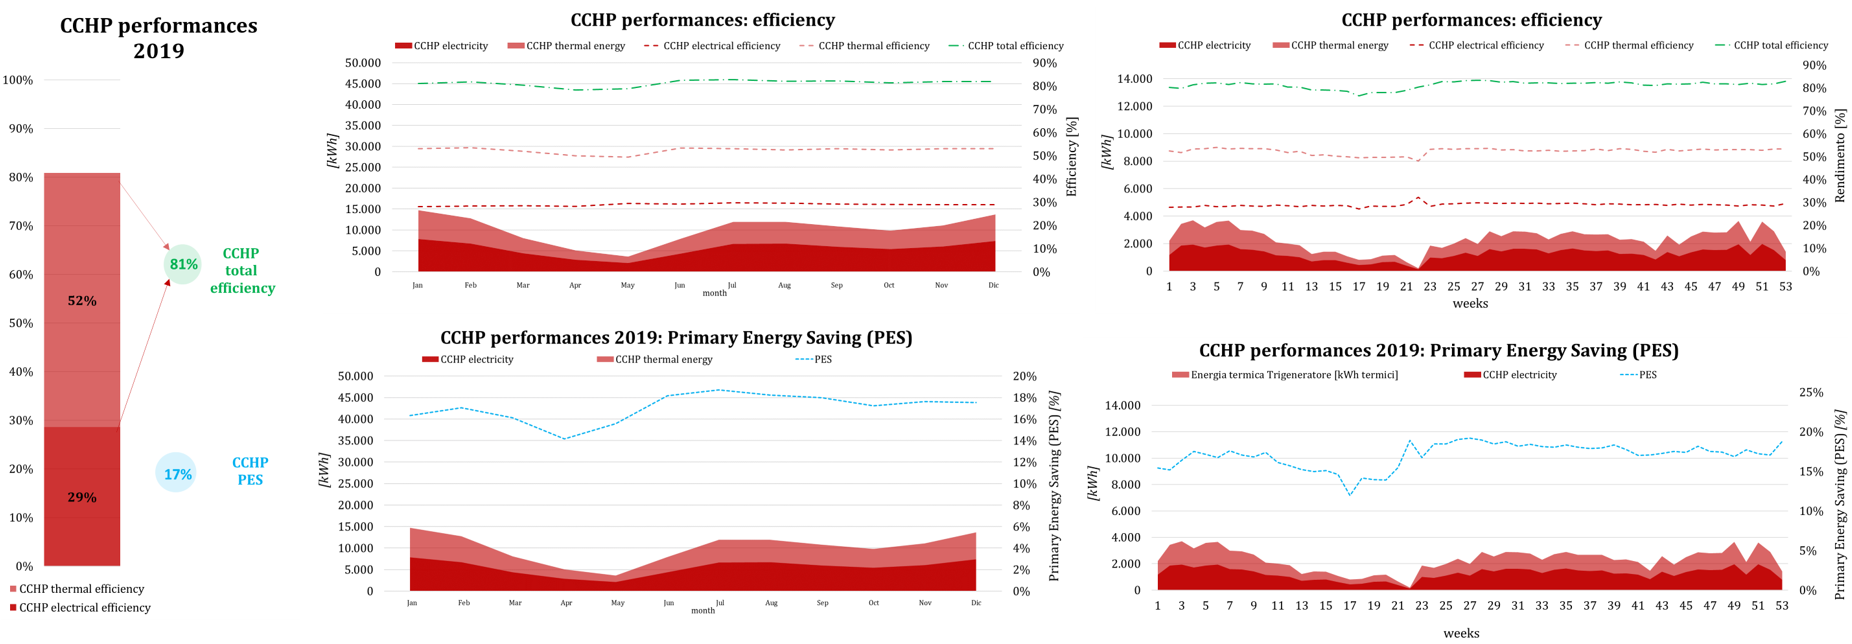
Figure 6 - CCHP 2019 – data and performances
What do you measure, and how?
The meters used are delivery points of electricity (POD) and natural gas (PDR); the data analyzed (for baseline and reporting period) are not estimated, thus they are provided directly by the supplier. We equipped the site in 2018 with a sophisticated monitoring and control system. The data obtained from this system are analyzed to determine the savings resulting from the implementation of ECMs.
Routine adjustment
For both electricity and natural gas consumption, the monthly degree days (DD) are the independent variable considered for our project, which includes both the office building and the warehouse. Monthly degree days (DD) are calculated with a reference of 25 degrees Celsius using data from the ARPAV meteorological station located in St. Pietro in Cariano (VR).
The monthly degree days (DD) have been calculated as follow:
![]()
Figure 7 - Natural gas 2015 DD& consumption – the model
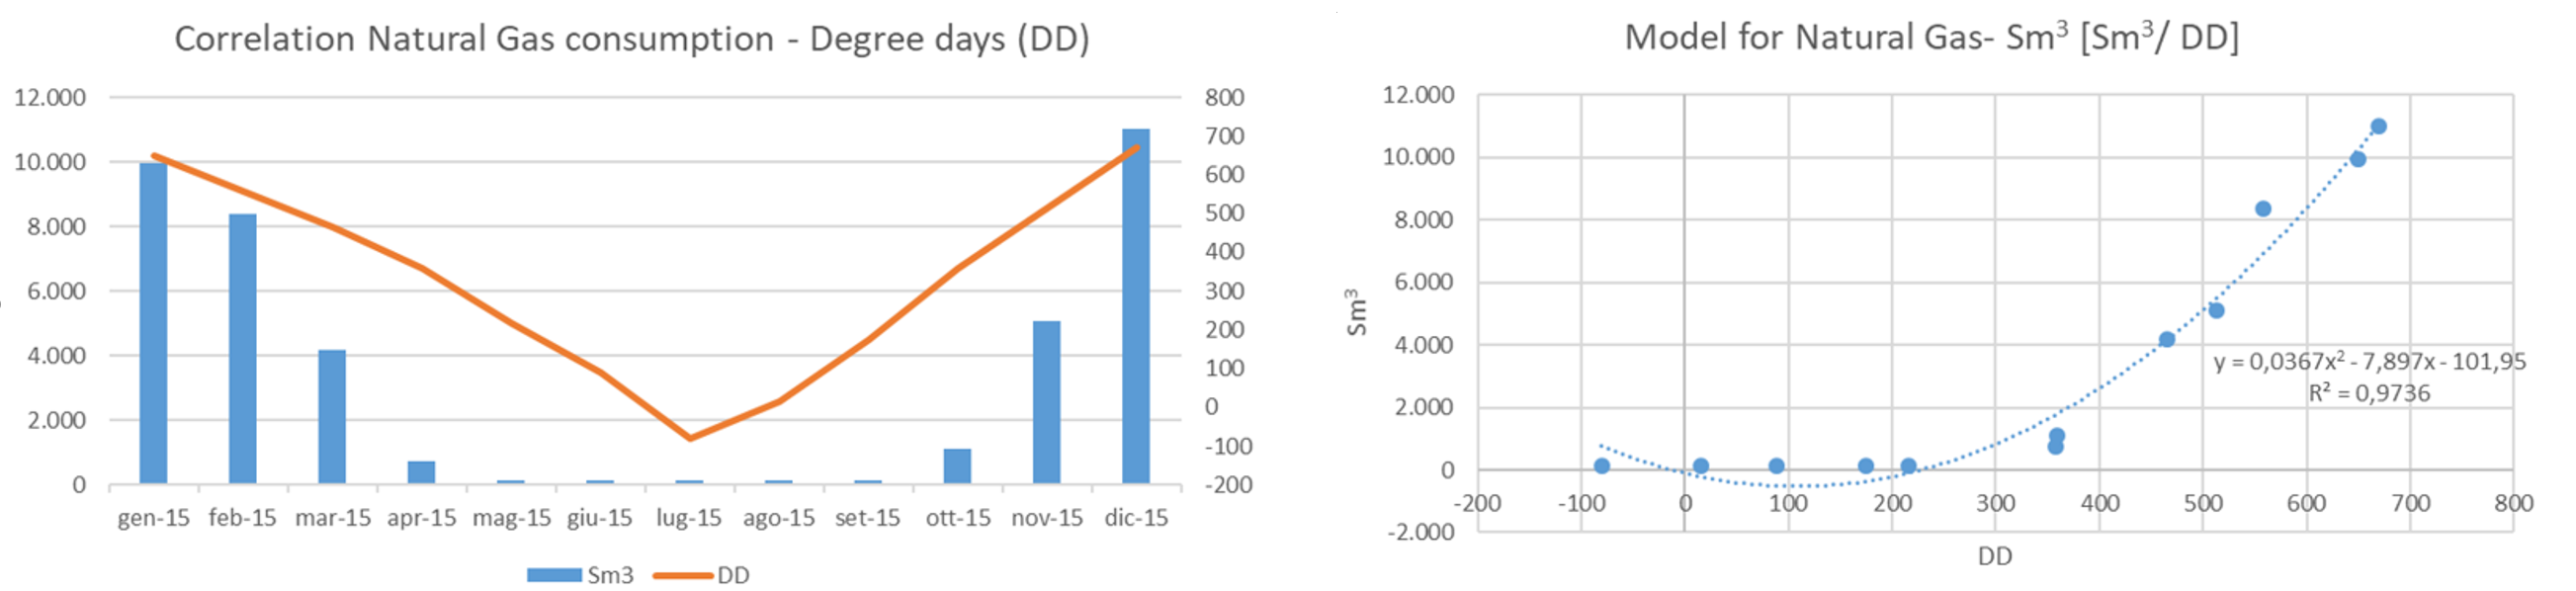
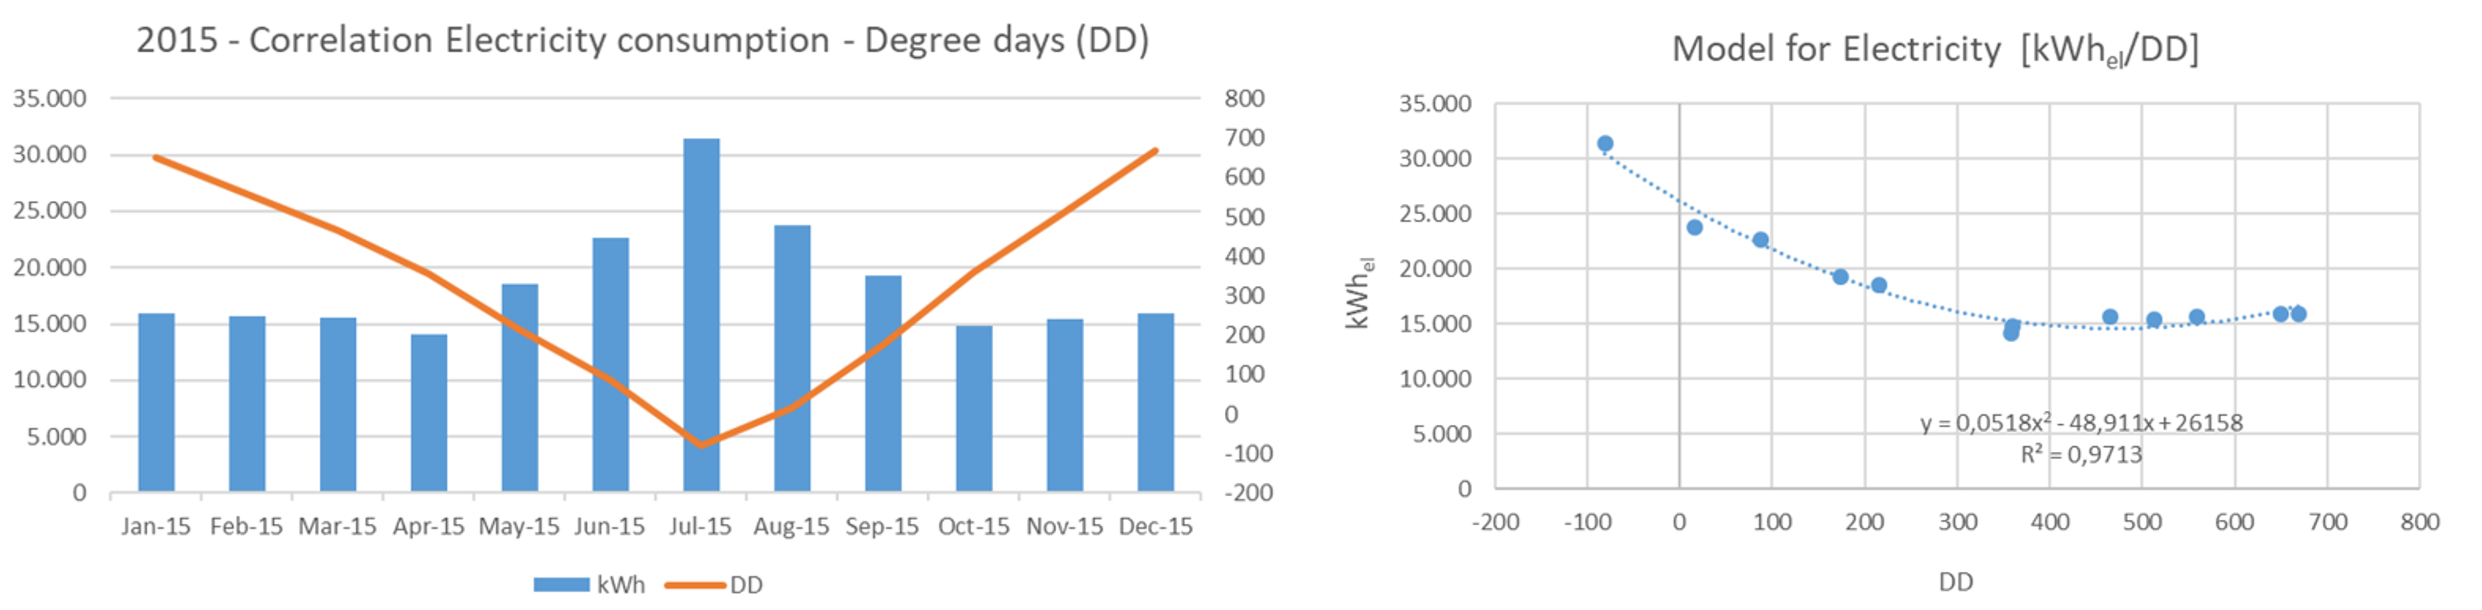
Figure 8 - Electricity 2015 DD & consumption - the model
What about non-routine adjustments?
Between 2015 and 2019, the building did not change its structure, use, type, and intensity of use to justify the use of static adjustment factors within the measurement boundary.
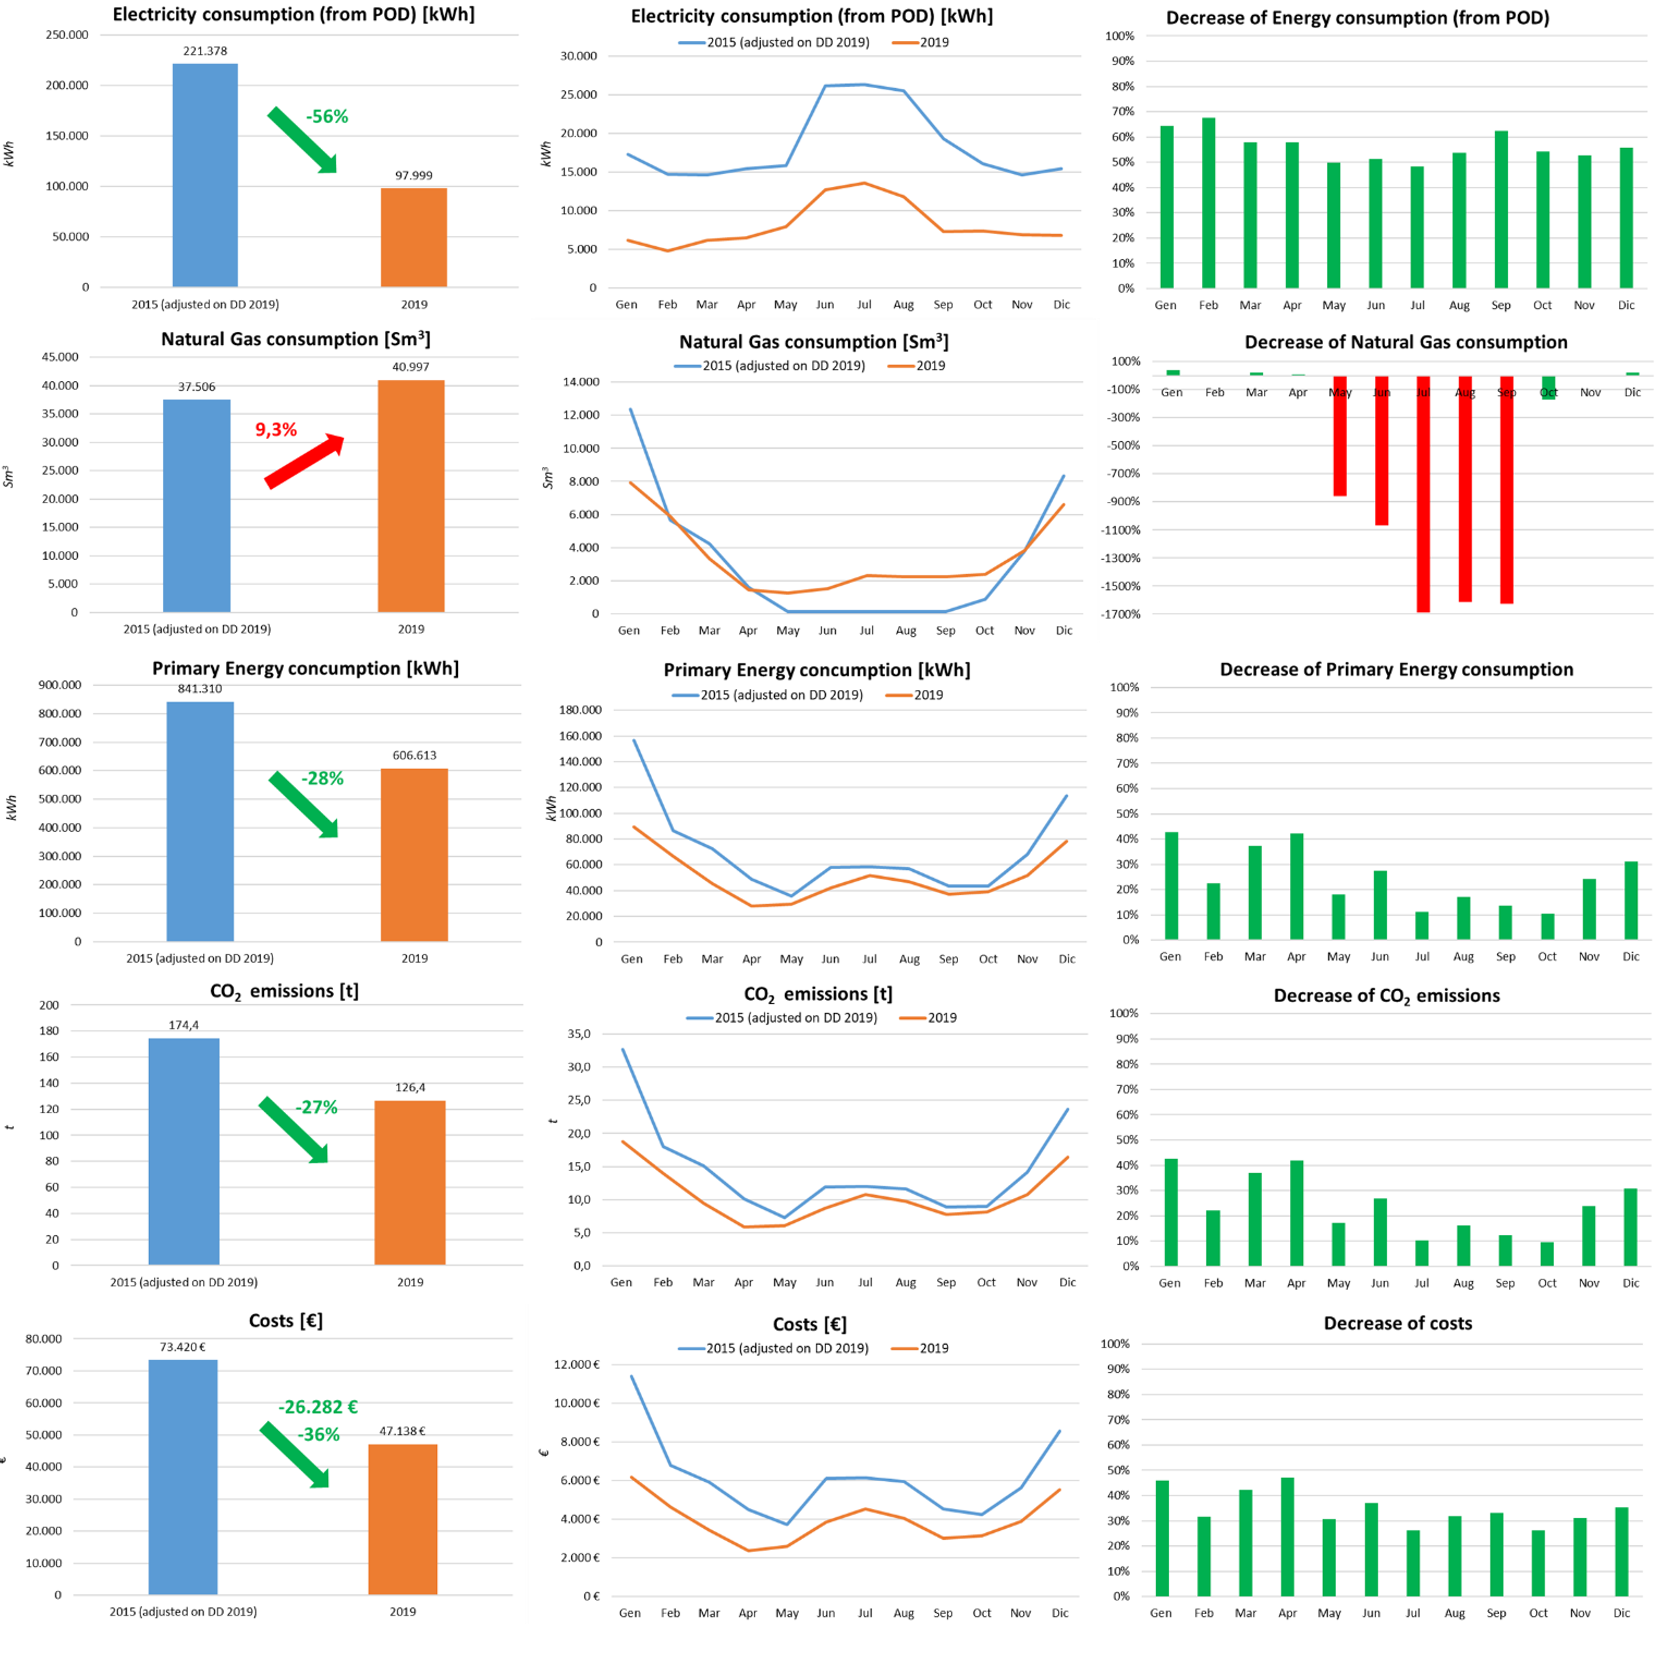
In short, being prepared with adequate M&V procedures in place, the answer came quickly:
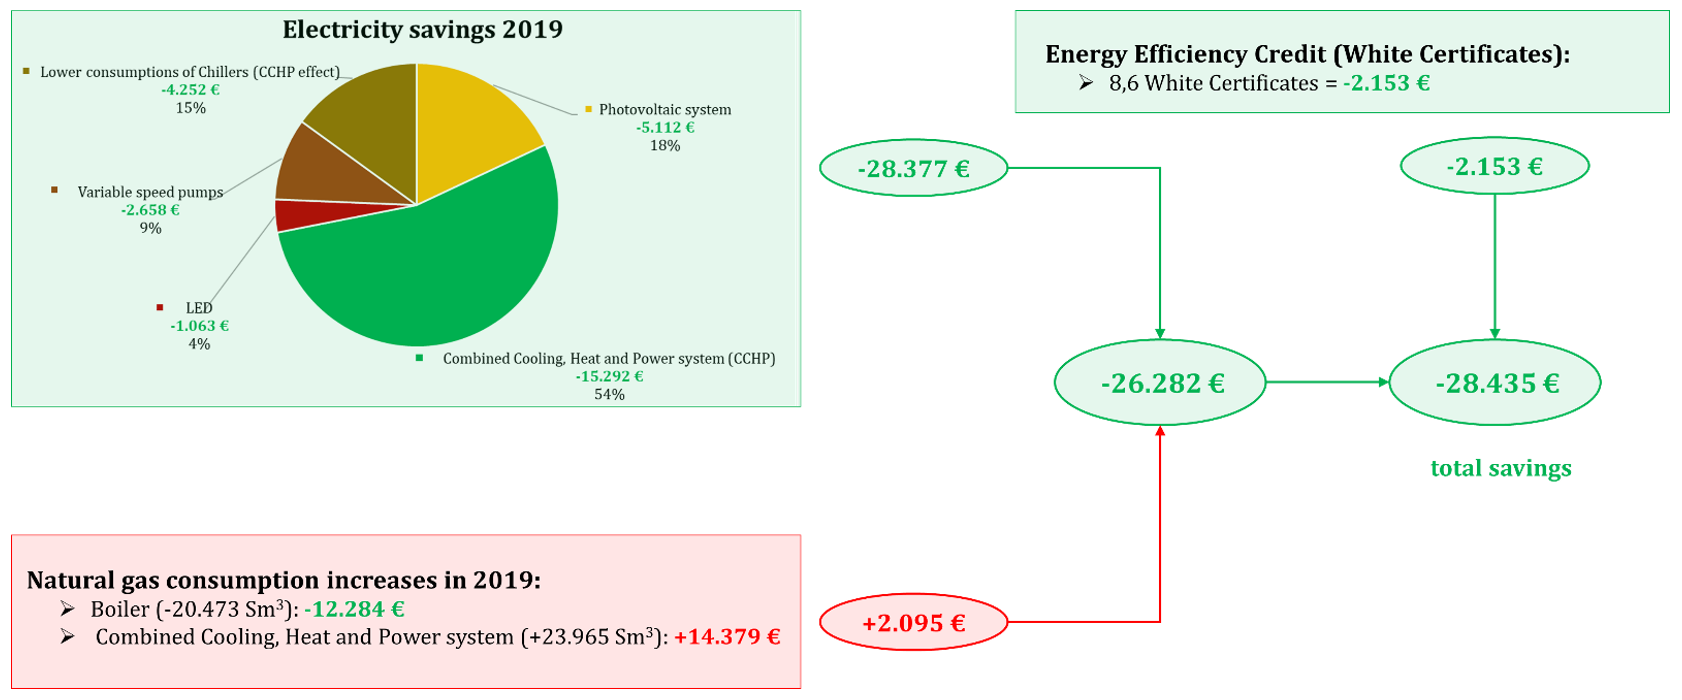
- Electricity consumption went down by 56 % (from POD), resulting in savings of 28.377 €.
- Natural Gas consumption increased by +9,3 % resulting in an additional cost of 2.095 €.
- Overall, primary energy needs decreased by 28 % or 234.967 kWh.
- And CO2 emissions declined by 27 % or 47,9 tons.
Figure 9 - Savings

(*) Marco Rossi, Energy Consultant - Etanomics, CMVP
(**) Marco Memoli, Junior Energy Consultant - Etanomics
![]()