
![]() By Kevin Bourque*
By Kevin Bourque*
RETScreen is often used to verify energy savings under IPMVP’s Option C. Did you know that it can also be used for Options A, B and D? Read on to find out how RETScreen offers a full complement of tools for the M&V professional.
Overview
Measurement and verification (M&V) is prerequisite for all performance-based energy-efficiency projects to assess the quantitative outcomes of energy conservation measures (ECMs). The International Performance Measurement and Verification Protocol (IPMVP) provides a rigorous yet flexible framework for evaluating the performance of ECMs.
The IPMVP provides four M&V options for determining energy savings (Options A, B, C and D), grouped into system-level and facility-level energy savings. Options A and B are system-level methodologies, whereas Options C and D allow for determining the energy savings at the facility-level.
RETScreen Expert is a software tool to evaluate the performance of ECMs for all four IPMVP options. Although well-known as an assessment tool for Option C M&V, RETScreen can be used to assess the performance for all four IPMVP Options. RETScreen is available in 36 languages, has over 600,000 users in every country around the globe and is continuously developed by the Government of Canada and a network of national and international partners.
This article will explain how you can use RETScreen for all four M&V approaches outlined in the IPMVP.
RETScreen Expert’s Use in M&V
RETScreen Expert is an energy-management software tool used by facility operators, managers and decision makers to, among other things, verify a facility’s energy performance. Energy managers and facility owners use RETScreen to compare the predicted energy consumption or production baseline with the actual energy consumption or production level by selecting a baseline. We cannot measure savings directly since they represent the absence of energy consumption or demand. Instead, we identify a baseline period to establish the relationship between the energy consumption and what influences this consumption. We can then use that relationship to estimate what the energy consumption would have been had an ECM never been implemented. Next, we compare this predicted value to the actual energy consumption after the implementation of our ECM. The difference between the predicted and the actual values represents the energy savings and is shown in the RETScreen M&V chart.
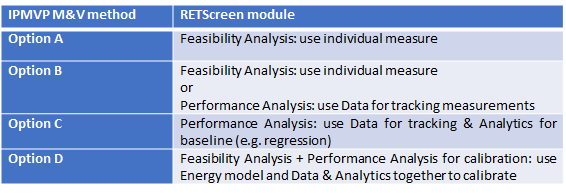
This, in a nutshell, is how RETScreen is used for Option C. But RETScreen can be used for IPMVP Options A, B or D to help validate the savings attributed to ECMs. In addition to analyzing an ECM’s performance, the modules in RETScreen enable project owners to assess whether their facilities’ energy savings can persist over time. Table 1 summarizes how RETScreen can be used for each option.
Table 1: RETScreen modules and models for all IPMVP options
IPMVP Options A and B — The Isolation Method
When the purpose of the M&V process is to verify the energy savings at the equipment or system level, a retrofit-isolation method (such as Option A or Option B) should be used. In these methods, the energy consumption for the equipment under study is isolated from the energy use for the whole facility, ensuring that the measurement boundary only encompasses the equipment or system affected by the ECM. RETScreen can then be used to verify the measured savings from the ECM.
Option A
Under Option A, we determine energy savings by measuring at least one key parameter of the system to which the ECM is applied.
To illustrate how RETScreen can be used to comply with IPMVP Option A, consider a lighting-retrofit project wherein we measure the power draw of the lighting fixtures by way of an RMS power meter. Furthermore, assume that the hours of operation of the lighting remain the same both before and after the retrofit.
In RETScreen’s Feasibility Analysis Module, we enter the power data we measured for the periods before and after the lighting retrofit. We can access the feasibility module by clicking on the ‘Feasibility Analysis’ icon on the ‘Facility’ page.
When defining the facility type in RETScreen, we select ‘Individual Measure’ since we’re using the Isolation Method and are only interested in this specific ECM. This is illustrated in Figure 1.
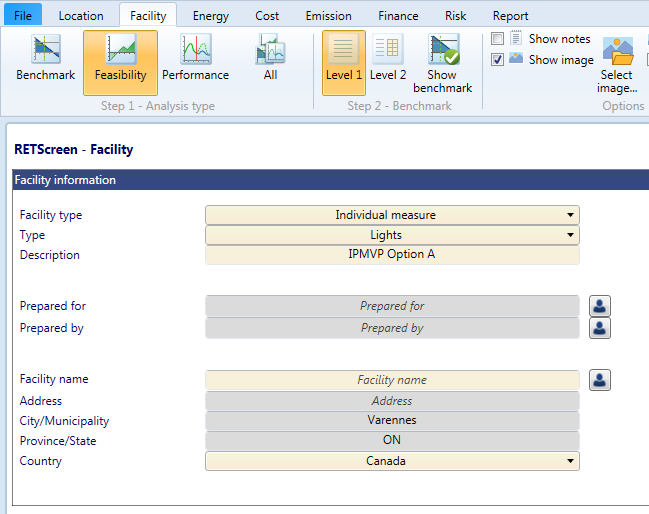
Figure 1: Configuration of an Individual Measure in RETScreen
We can use the Level 1 or Level 2 analysis for the lights end-use measure, making sure that the difference between the base and proposed case matches the measured parameter. In this lighting-retrofit example, the power draw is the key parameter measured before and after the implementation of the ECM. Using Level 2 in our example, we change only the electricity load per lamp, keeping the number of fixtures and operating hours constant since they are not measured and assumed to be the same between the base and proposed case. The savings are thus only attributable to the measurement of the key parameter in this isolated ECM as shown in Figure 2.
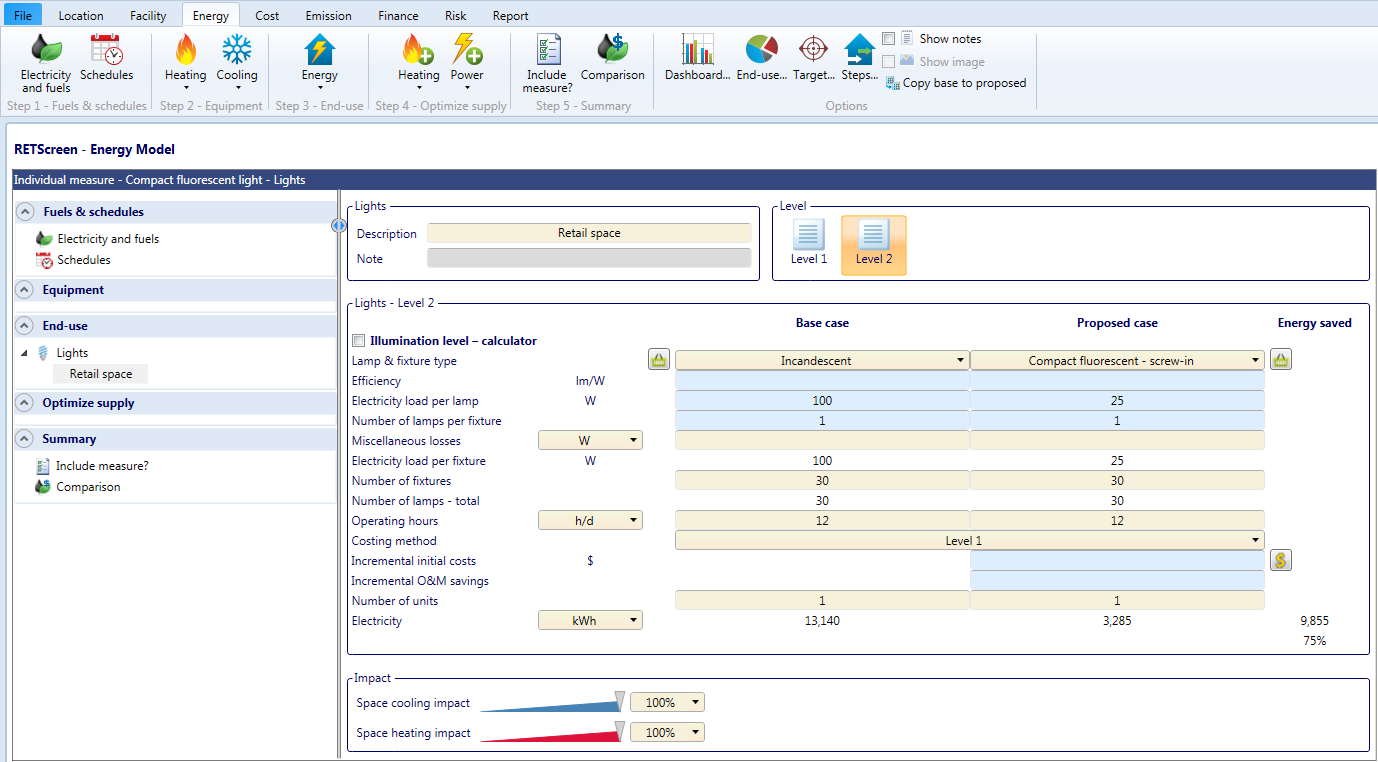
Figure 2: The Lights Level 2 tool selected for the lighting-retrofit project
RETScreen’s base case corresponds to the measurement period before the ECM while the proposed case corresponds to the period after the ECM is implemented. RETScreen calculates the annual electricity consumption for the base case and proposed case systems and the annual energy saved. These engineering calculations satisfy Option A in determining energy savings. In our example, the lighting retrofit saved 9,855 kWh of electricity.
Option B
Option B also applies to an isolated system, but here we measure all the parameters affecting energy consumption. Extending our lighting-retrofit example, suppose that in addition to more efficient lights, our ECM also involves the installation of occupancy sensors. Now the energy consumption will be affected by more than one parameter. Since we cannot isolate one single parameter, IPMVP’s Option B is most appropriate for our analysis.
We can take two approaches. First, we can continue with the Level 2 feasibility analysis as above, but include all of the changed parameters. For example, we will specify the difference in the electricity load per lamp as before, but also include changes in operating hours, and even in the number of lamps per fixture (if that had changed). As before, we need to ensure that measurements of key parameters are done before (baseline period) and after the ECM implementation (retrofit period) to comply with the IPMVP protocol.
The second method employs RETScreen’s Performance Analysis Module to track the electricity consumption for the lighting circuit and then uses this data to calculate energy savings.
Figure 3 shows the electricity consumption of the isolated system. The data source is the installed metering equipment. We do this by adding an ‘Electricity consumption’ table from the menu and then adding or importing the measured data.
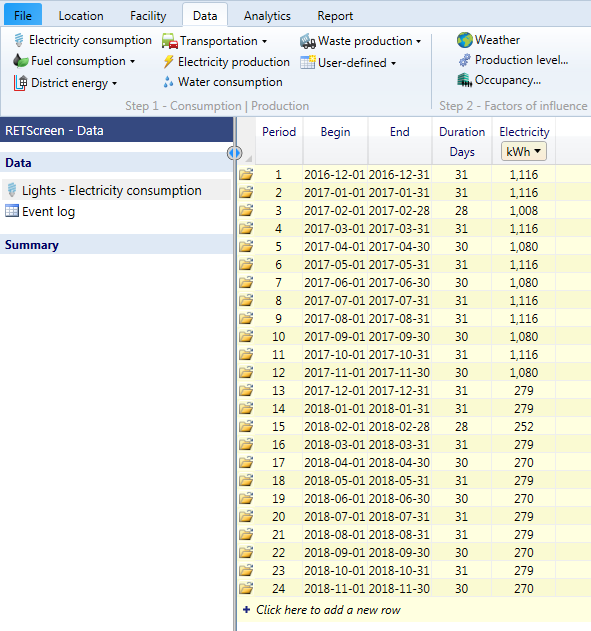
Figure 3: Using RETScreen’s data page for IPMVP Option B
RETScreen’s Analytics page can be used to determine the savings using this measured data. The software includes an ‘Annual bar graph’ that permits us to visualize the above data on an annual basis (see Figure 4).
If we were to use the electricity consumption data from our Option A example, we can see in the table below the graph that the data corresponds exactly to the values we obtained when modelling the energy savings in the lights tool on the Energy page. The savings here match the 9,855 kWh we found previously under Option A
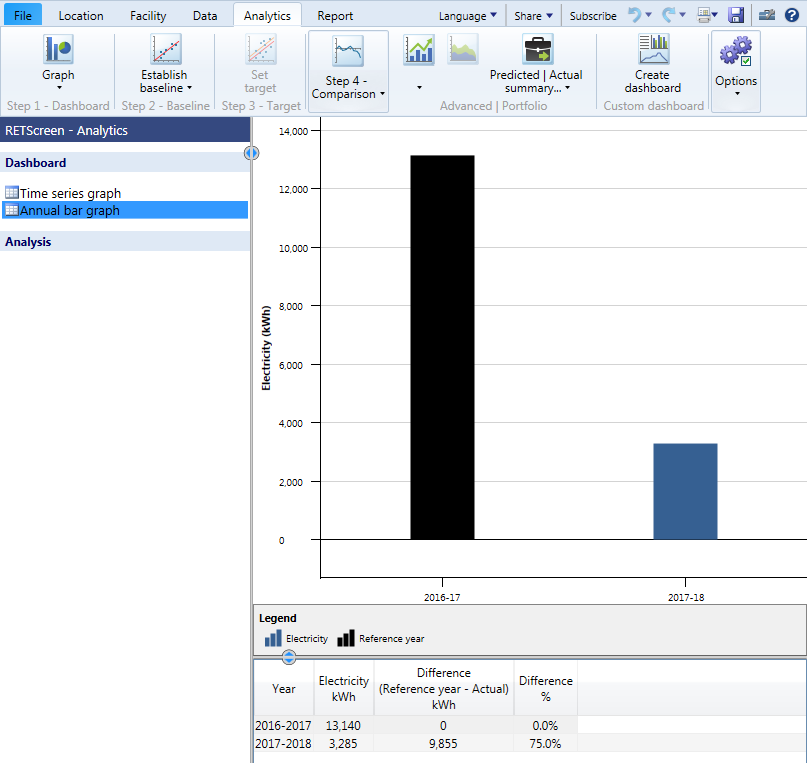
Figure 4: Using RETScreen’s graphs for IPMVP Option B energy savings verification
Note also that we can overlay data collected about the retrofit directly onto a graph of the measured data. Using the ‘Time series graph’ in RETScreen’s Graph section on the Analytics page, the lighting retrofits even has been added using the ‘Event tracker’ from the Options section in the menu (see Figure 5).
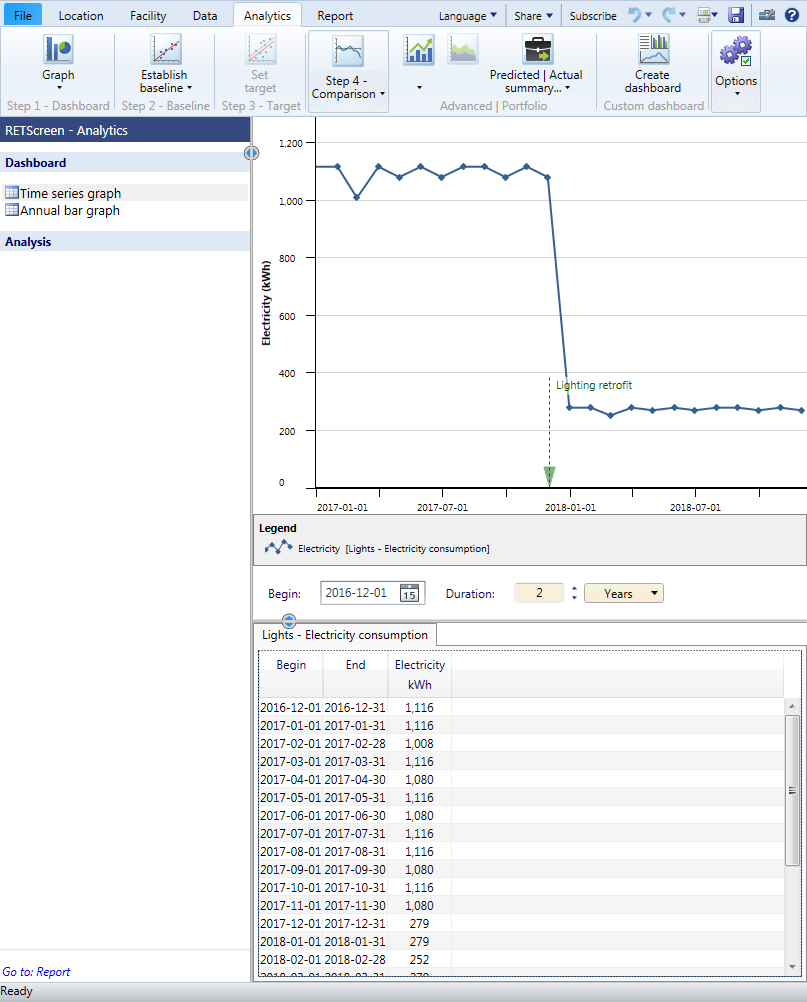
Figure 5: Using RETScreen’s graphs to show ECM impact on energy consumption
IPMVP Options C and D — The Whole-building Approach
If the purpose of the M&V is to assess the impacts of one or more ECMs on the various systems of a facility, then IPMVP Option C or D will be more appropriate. We use these methods when we cannot isolate the energy consumption measurement of a single piece of equipment. Option C or D are also appropriate when the ECMs will affect multiple systems in a building. We choose Option C or D depending on whether or not base-year data is available. Again, RETScreen Expert can be used for both of these methods.
Option C
We use Option C when we have access to energy consumption data for the whole or sub-facility. This data can come from meters or sub-meters, invoices or data from the utility. We use this data to assess the energy performance of the whole building.
We establish a base-year period through continuous measurement of energy use for the whole- or sub-facility. The measurement continues after the retrofit so that we can quantify the savings achieved over time.
To illustrate how we can use RETScreen for Option C, consider a building heated by natural gas. The owners have installed a new energy efficient heating system in the building and want to verify the energy savings. We have several years’ worth of measured gas consumption data.
In RETScreen, the Performance Analysis Module is used to both collect the data we need and to deploy various comparison and normalization tools to determine energy savings. This module is accessed by clicking on the ‘Performance Analysis’ icon on the ‘Facility’ page. We then enter our data into the ’Data’ worksheet, as illustrated in Figure 6.
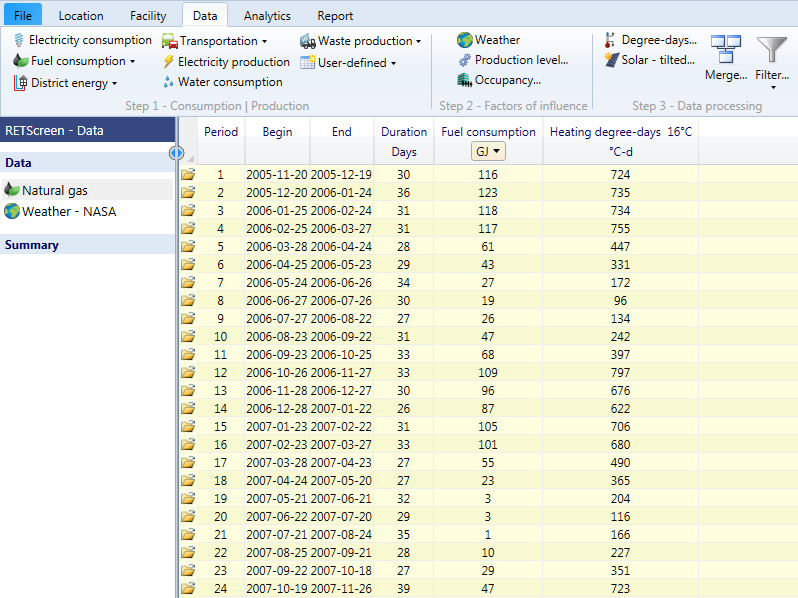
Figure 6: The Data table with the natural gas fuel consumption and merged with the HDD from the weather table
Note that in addition to the energy consumption data, we need to collect data on the parameters which can influence the energy consumption. RETScreen calls these factors of influence and can include weather, occupancy, changes in production or anything else which could drive energy consumption. In our example, weather, or more precisely, the heating-degree days (HDD), is the primary factor of influence in this case.
In RETScreen, we add the weather table by clicking on the ‘Weather’ button in the ‘Step 2–Factors of influence’ menu. RETScreen can conveniently download the weather data automatically from NASA and calculate degree-days at the click of a button. Once this is done, we can merge the HDD column into the natural gas table so that all of the data we need to normalize our fuel consumption is in one place.
Next, the tools on RETScreen’s ‘Analytics’ page are used to correlate the energy-consumption data with one or more independent variables. We do this by clicking on the ‘Establish baseline’ button in the menu and selecting ‘Regression analysis’. After choosing the dependent and independent variables from the natural gas data table and the baseline duration, RETScreen generates a regression analysis along with several graphs. An X-Y scatter graph shows the dependent variable (y) as a function of the independent variable (x) and a time series graph show the evolution of the parameters over time. The scatter graph is shown in Figure 7.
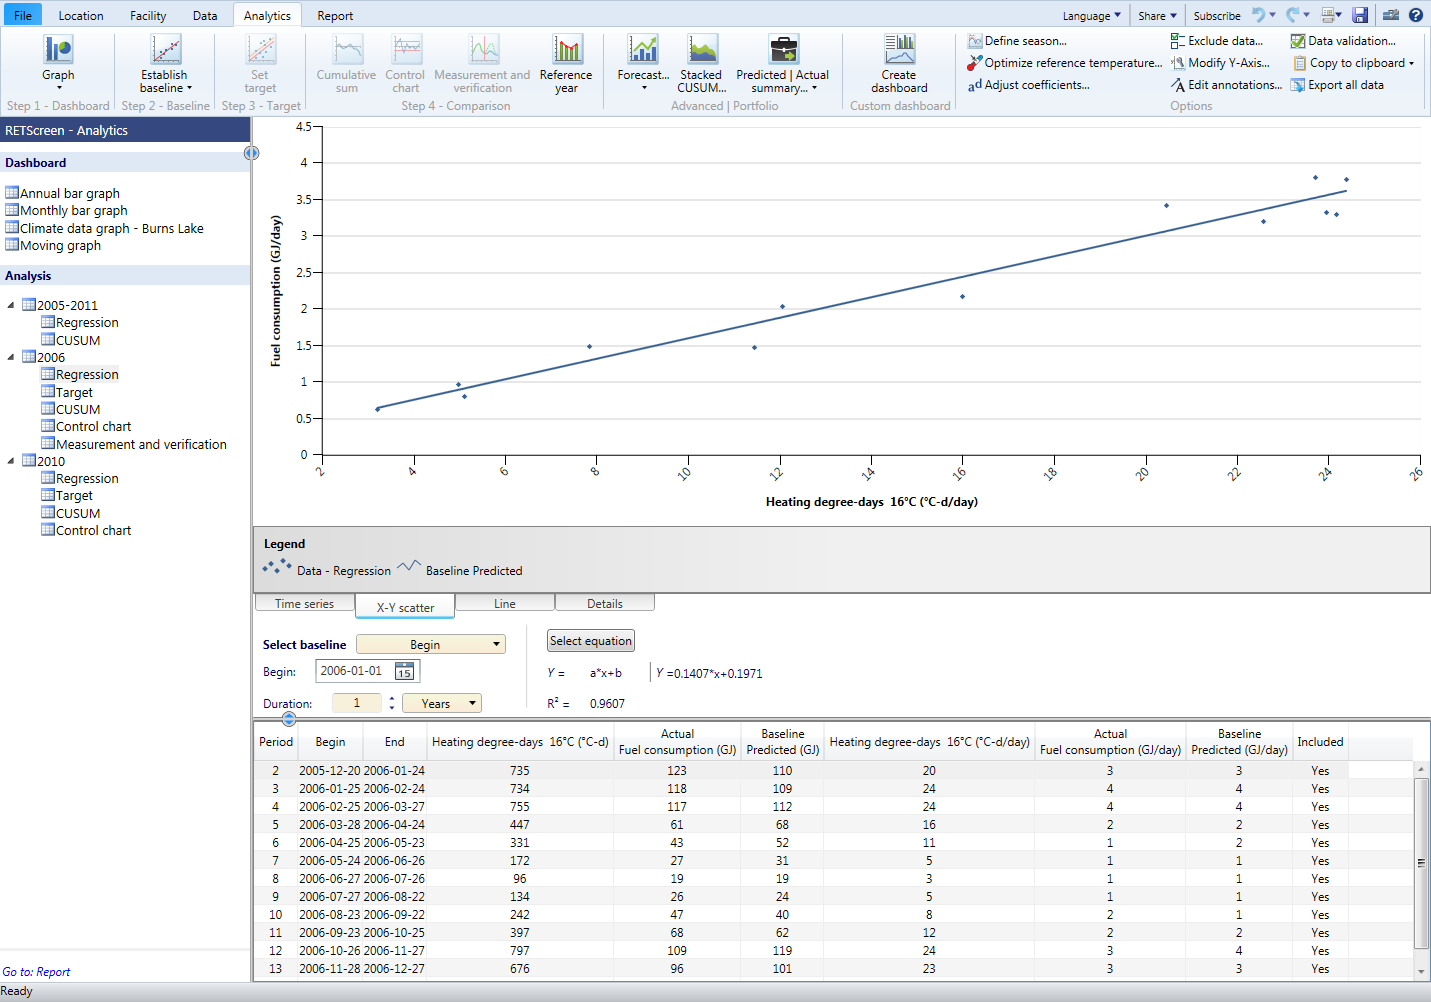
Figure 7: Baseline regression analysis in RETScreen
Making non-routine adjustments (i.e., those related to the number of occupants, production shifts, etc.) is a significant challenge associated with Option C. RETScreen is able to handle such non-routine adjustments in the regression analysis, but the details of how to do so are the subject of a separate article.
To quantify the uncertainty associated with regression-based savings estimates, several statistical values need to be calculated. RETScreen calculates many of these, including the coefficient of determination (R²), the root-mean-square error (RMSE), the standard error, p-values and more. These values are found in the ‘Details tab’ of the Regression view as illustrated in Figure 8.
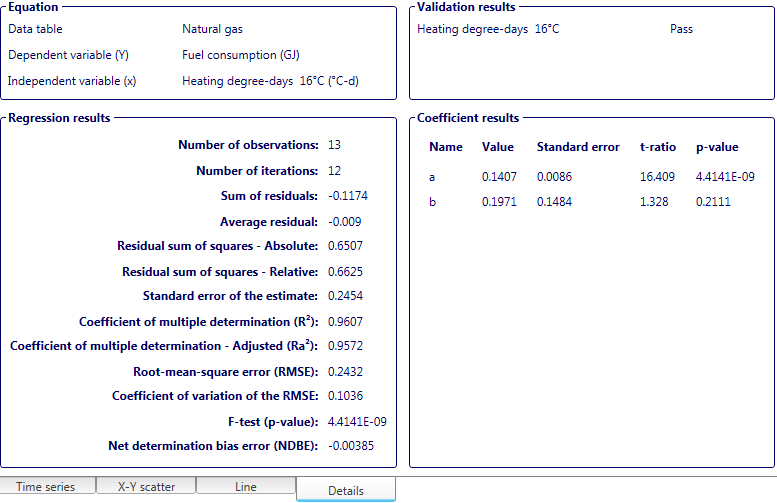
Figure 8: Regression statistics available through RETScreen
We are now in a position to use the baseline regression model to estimate the baseline energy consumption adjusted to the post-retrofit conditions. This estimated energy consumption can be compared to the actual energy consumption to estimate the energy savings of the project. Clicking on the ‘Measurement and verification’ button in the menu will automatically create a graph clearly showing the baseline period, the actual fuel consumption and the net savings. This graph can be used directly to verify our savings under Option C. See Figure 9.
When estimating the energy consumption savings, it’s important to keep in mind that the predicted energy consumption is just that, a prediction. All models have some degree of uncertainty which affects our ability to make predictions. Energy managers need to be especially vigilant that the energy savings are neither overstated nor understated. They do this by paying attention to the accuracy of the model and the accuracy of the predictions. The information needed to do this analysis can be found in the regression statistics shown in Figure 8. This is an important topic which merits a separate discussion in a future article.
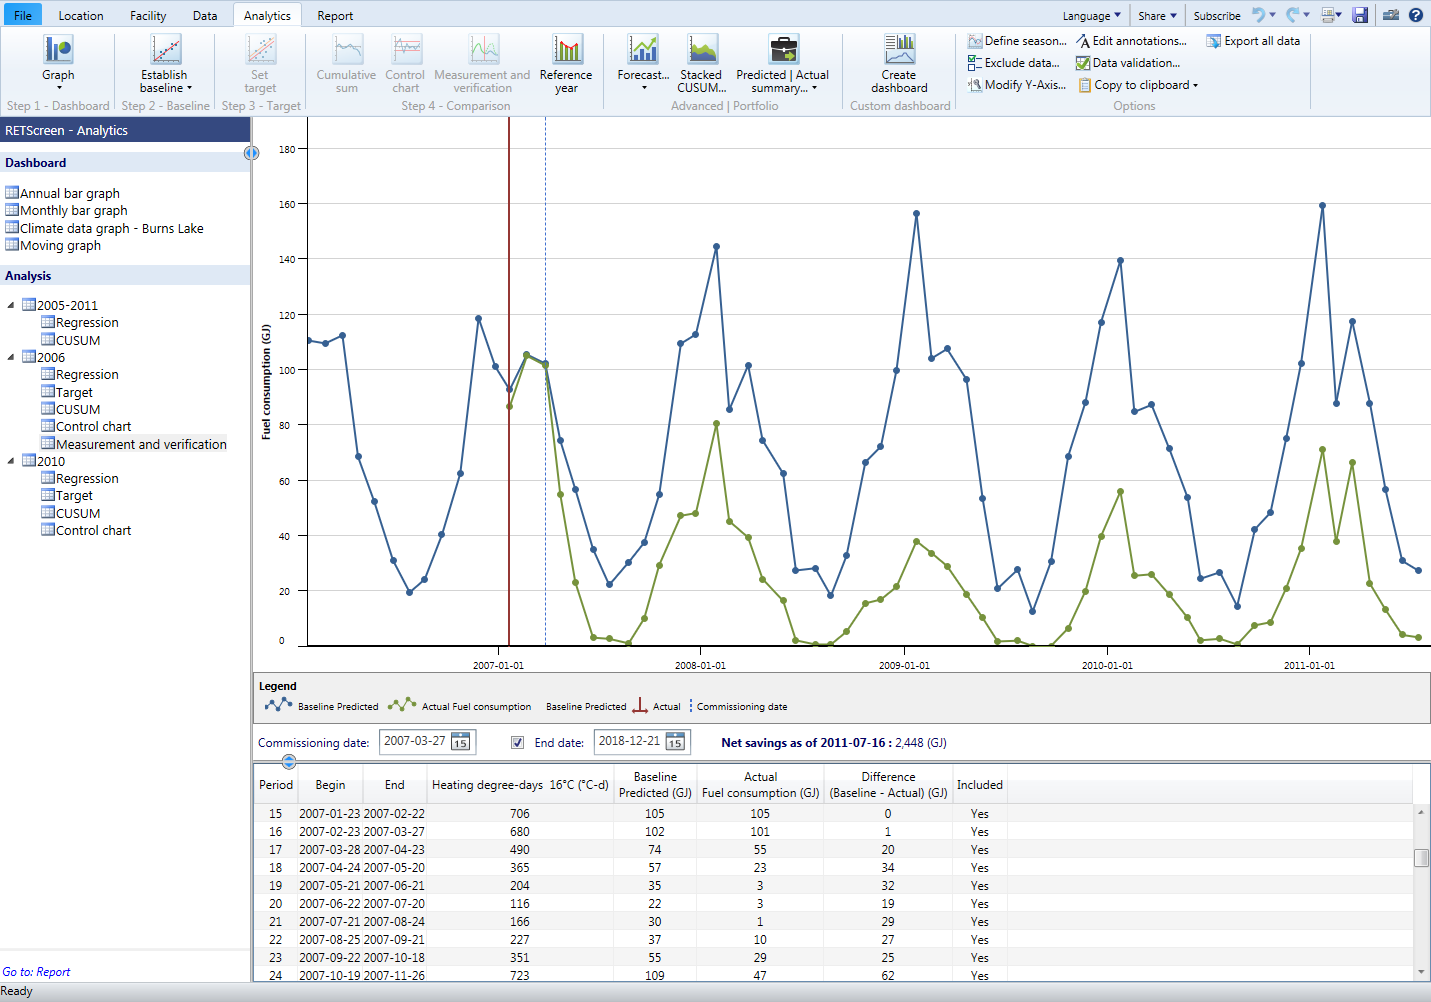
Figure 9: RETScreen’s M&V graph and tool can be used to verify savings in Option C
Option D
If measured data for the baseline period is unavailable or unreliable, we can use IPMVP Option D to determine the savings. We can create a calibrated simulation with RETScreen using both the Feasibility Analysis and Performance Analysis modules. First, use the Feasibility Analysis to establish the baseline period by modelling the building. Then, leverage the Performance Analysis module to calibrate the model over the post-retrofit period.
As an example, consider a deep-retrofit project on a building which is part of a campus with a single electricity meter. While the deep-retrofit project is being carried out, appropriate meters should be installed for the building. The data collected by these meters will be used to calibrate the simulation model in RETScreen’s Feasibility Analysis module by using the data from the Performance Analysis module.
To create the initial simulation model, we can take advantage of the large number of whole-facility archetypes available in RETScreen’s Virtual Energy Analyzer. These provide a convenient starting point which we can then adjust to match our facility.
After modelling the base case (pre-retrofit) and proposed case (post-retrofit) facility on the Energy page in RETScreen, we collect the energy consumption data for the post-retrofit period just as we did for Option C. This data is used to adjust the energy models so that the proposed case energy consumption matches the data collected. One of tools we can use to calibrate the energy models is the ‘Annual Bar Graph’ on the ‘Analytics’ page.
In our deep-retrofit example, assume that we’ve modelled the base and proposed case on the Energy page and that we’ve collected the energy consumption data on the Data page. We now want to ensure that our model represents our building, so we proceed to use the energy consumption data to help us adjust our proposed case energy model.
Using the Annual Bar Graph for electricity, we can see that the last complete year of data has a total electricity consumption of 1,193,011 kWh (see Figure 10).
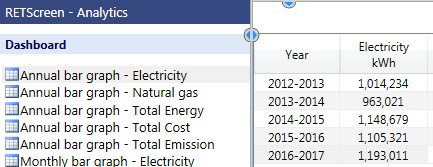
Figure 10: Using RETScreen’s annual bar graph to help calibrate our model
Back on the Energy page, we can use the ‘Comparison’ tool in the menu to help with our project verification. In Figure 11, we see that the fuel consumption for electricity calculated by our calibrated model is 1,193,442 kWh. We enter the actual electricity consumption from the ‘Annual Bar Graph’ and RETScreen calculates the variance between the model and the actual data in the reporting period. We repeat this comparison for each of the fuels used in our facility.
To comply with the IPMVP, the prediction of the energy consumption must be within 15% of the actual value, on a monthly basis, and within 5% of the actual energy consumption, on an annual basis. Only then the model can be considered calibrated and be used to estimate what would have been the energy consumption without the ECMs.
The calculated savings are on the Energy page in the ‘Comparison’ tool in the ‘Savings’ section. This data is a summary of the final total row in the ‘Include measure’ tool.
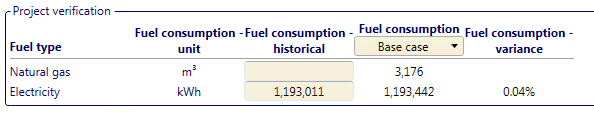
Figure 11: Option D can leverage RETScreen’s modelling and data capabilities
Beyond M&V
RETScreen is a readymade tool to model IPMVP Options A, B, C and D. In addition to verifying the energy savings of a project, RETScreen can help maintain persistent savings year after year. M&V is not a once-and-forget-it project; using RETScreen makes it easy to measure and verify in the subsequent years of the reporting period and to monitor the performance of the ECMs.
RETScreen’s ability to incorporate and analyze all of the relevant data in one file means the software is a low-cost tracking tool for assessing savings potential and verifying energy performance over time. RETScreen lets energy managers focus on the bigger picture of energy management instead of having to spend time moving data around in spreadsheets.
On a final note, RETScreen Connect is a powerful tool to help automate and streamline M&V for owners of multiple facilities. By linking directly to data sources and other software tools, RETScreen Expert lets facility owners automatically connect a facility’s energy consumption data with RETScreen’s powerful analysis and reporting capabilities.
REFERENCES
1. The International Performance Measurement and Verification Protocol: Concepts and Options for Determining Energy and Water Savings, Volume 1, the Efficiency Valuation Organization, September 2010.
2. The International Performance Measurement and Verification Protocol: Core Concepts, the Efficiency Valuation Organization, October 2016.
3. NASA Prediction Of Worldwide Energy Resources, https://power.larc.nasa.gov
4. Performance Analysis with RETScreen Expert, https://www.youtube.com/watch?v=4uXZo-byATU
5. Feasibility Analysis with RETScreen Expert, https://www.youtube.com/watch?v=XWArgIhZkwc

(*) Kevin Bourque is Senior Engineer, Innovation and Energy Technology Sector, Natural Ressources Canada - RETScreen International.
With special thanks for contributions by Geneviève Gauthier, Aurélie Vérin, Farah Sheriff, Stephen Dixon and Dinesh Parakh.